

What can be done to reverse the decline of Canada's real GDP per capita?
What can be done to reverse the decline of Canada's real GDP per capita?

There has been much concern among economists and policymakers in Canada recently about the decline in real GDP per capita since mid 2022. Real GDP per capita is closely related to average well-being, although there are of course other factors affecting well-being aside from the market income that is measured by GDP.1
In an earlier paper I showed that real GDP per capita can be expressed as the product of five factors.2 These are:
Business sector labour productivity,
Average hours worked per job,
Employment relative to the working-age population,
Demographic aging and
The size of private business GDP relative to total GDP.
The rising share of non-permanent residents (NPRs) in the Canadian population is a special factor affecting GDP per capita recently. The contributions of NPRs and permanent residents (PRs) to Canada’s per capita GDP are quite different. This was unimportant in the past because the share of NPRs in the total was small. However, in the last several years this situation has changed and the share of NPRs has become a lot larger. This was the result of government policy that could, since NPRs are temporary residents, be reversed without much difficulty if it was deemed desirable. This paper examines the role this surge in NPRs has played in the recent decline in Canada’s GDP per capita.
1. Why has population increased so rapidly of late?
Why has Canada’s population expanded so rapidly of late? It’s not because of natural population growth. Births net of deaths were lower in the most recent four quarters at 28,527 than in the previous four (see Table 1) and these numbers are only about 0.1% of the total population anyway. Immigration net of emigration was also lower in the more recent period, at 419,039, than in the previous one when it was 457,697, although immigration has certainly been a major factor in population growth for a long time. The big and unexpected factor, as has become widely understood among economists and demographers, was large increases in the stock of NPRs, 804,690 in the most recent four quarters and 330,840 in the previous four-quarter period.
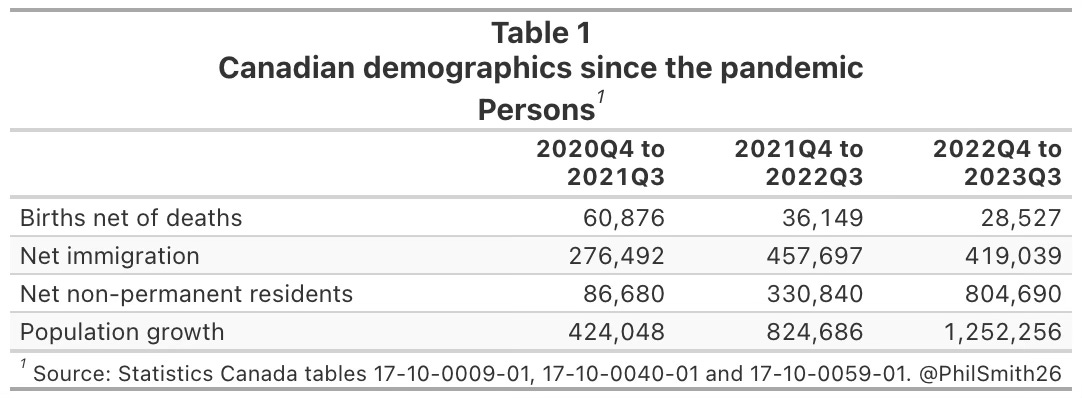
Chart 1 shows how the stock of NPRs has trended up since 1971, when the number was just 139,529. As recently as 2016 they still numbered fewer than one million people. Thereafter the pace of growth picked up considerably. The number stabilized somewhat in the Covid-19 years in the vicinity of 1,300,000 but in 2022 it took off like a rocket. The stock was 2,511,437 NPRs as of the third quarter of 2023.
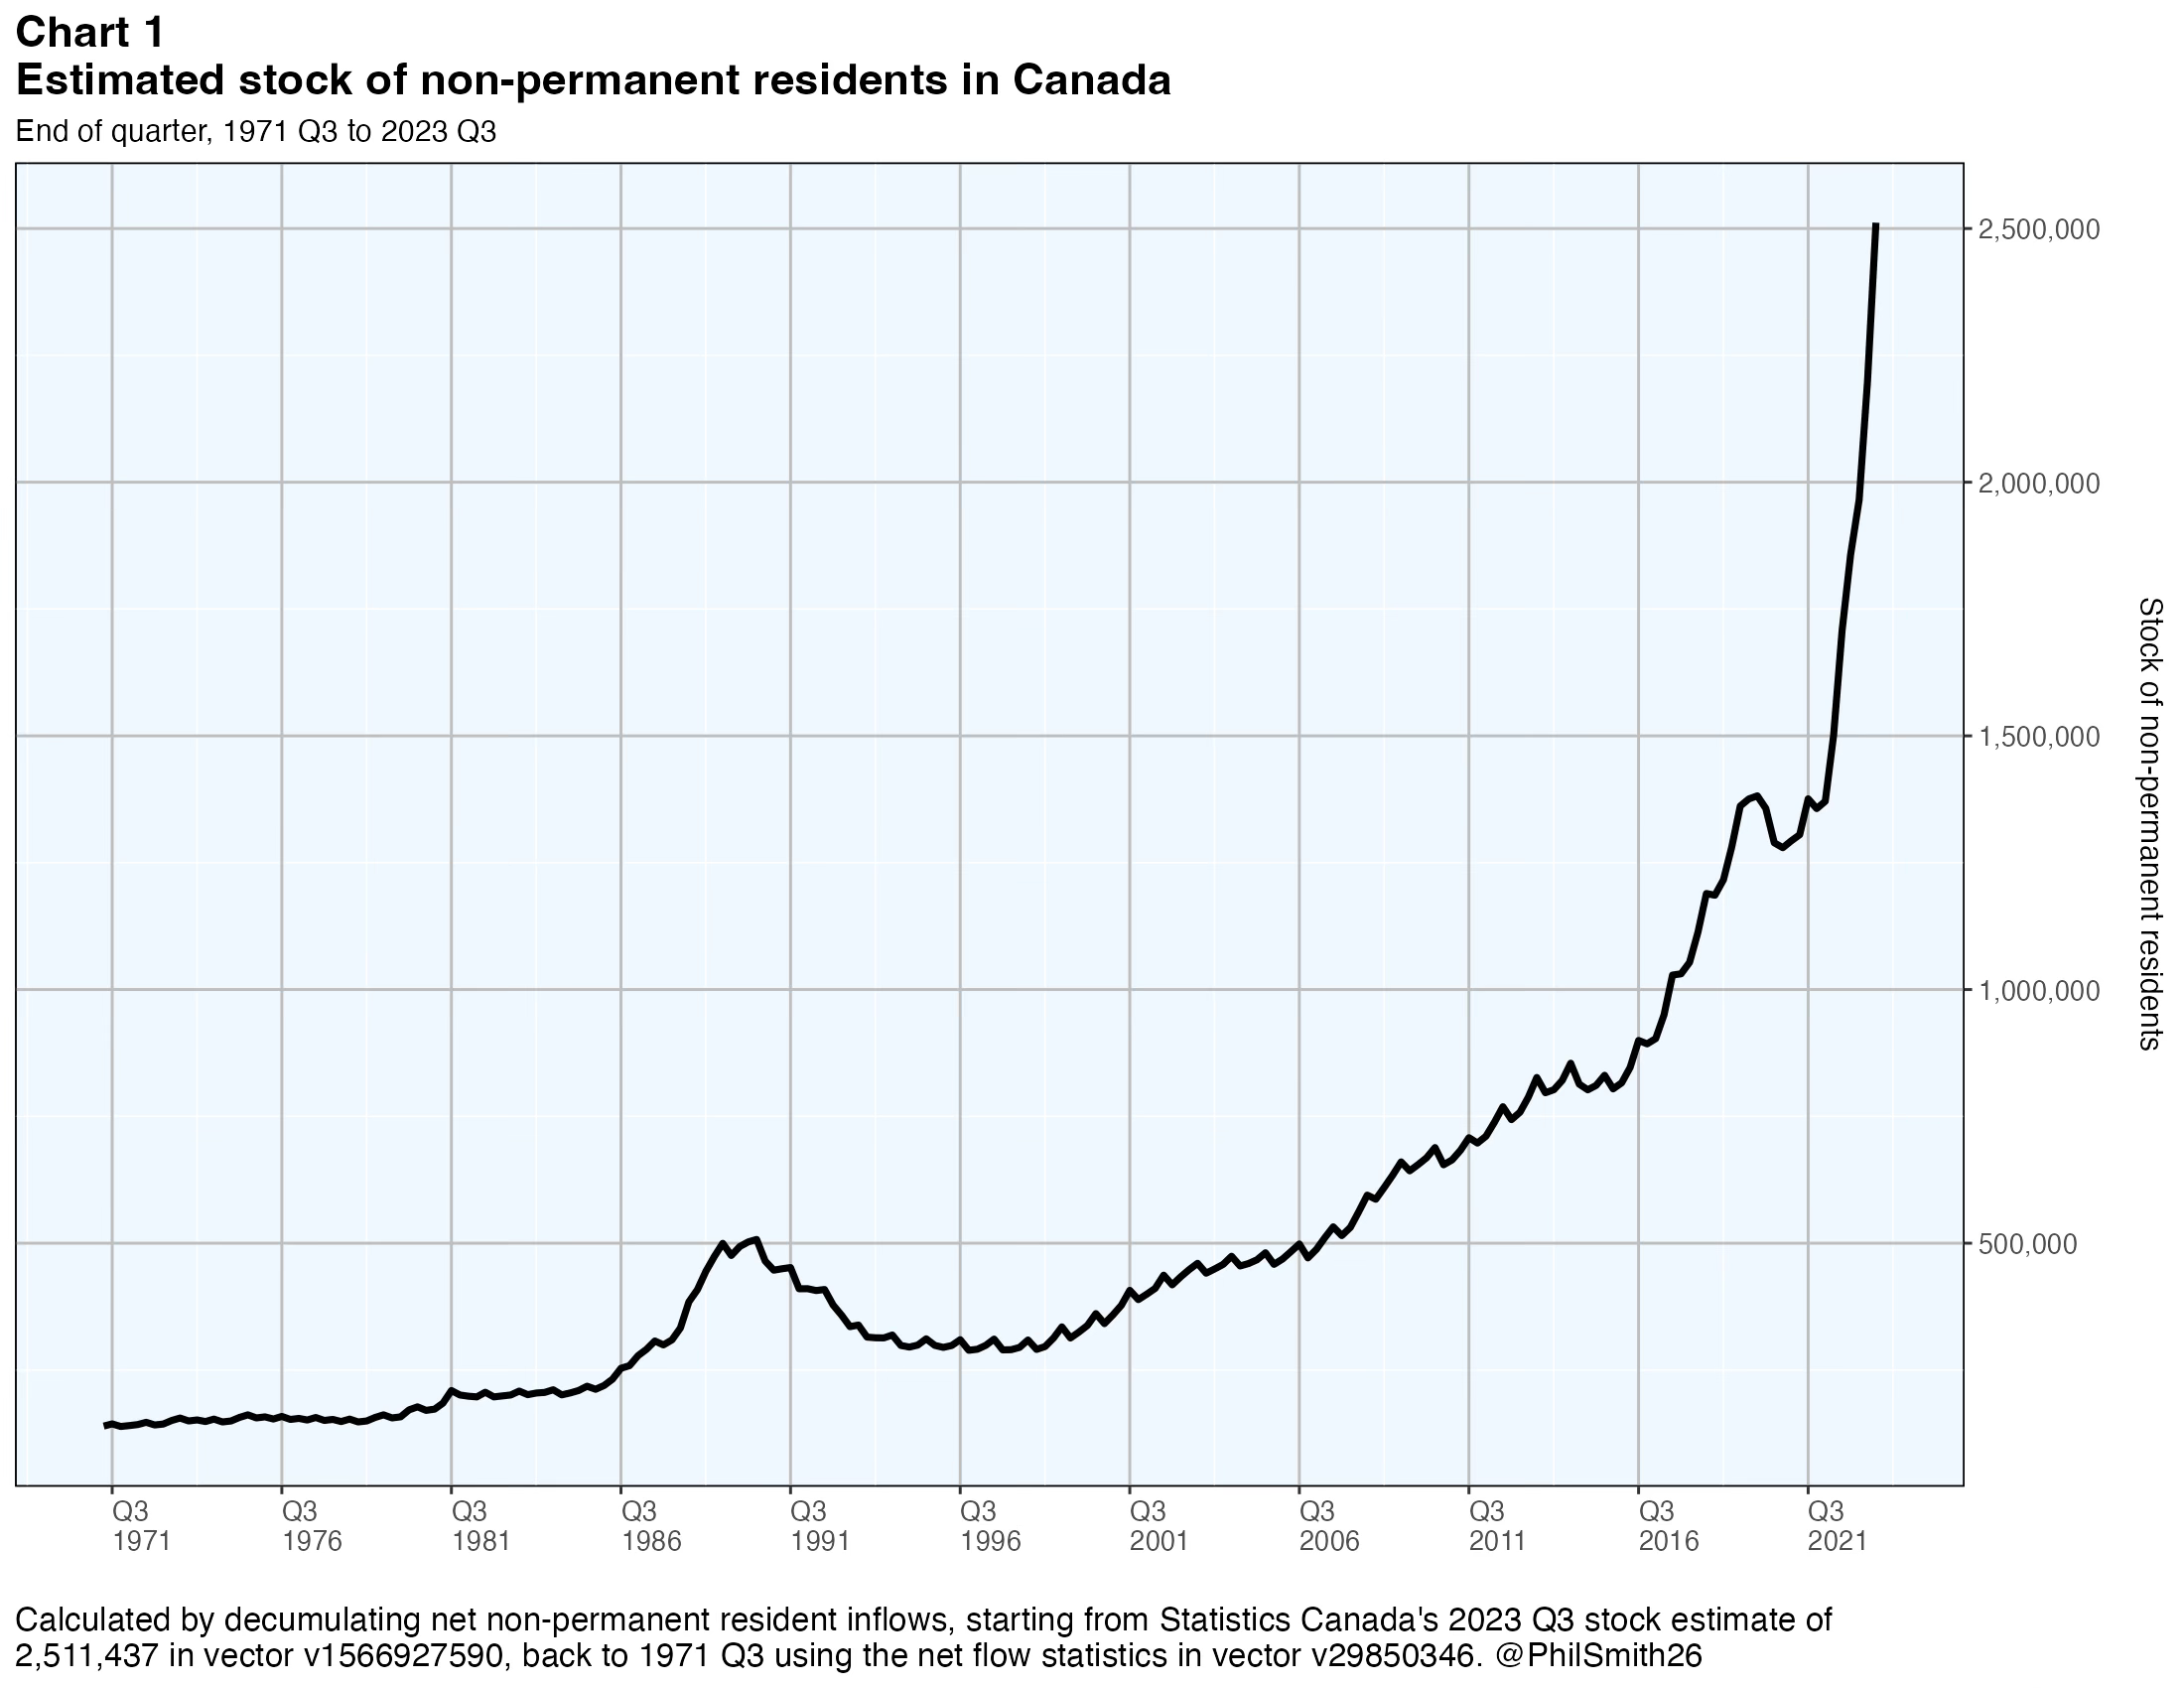
The stock of NPRs has grown far more than in proportion to the population. As a percentage of the total population the stock rose from just 0.6% in 1971 Q3 to about 3.5% in 2020 and 2021, and most recently to 5.5% in 2023 Q3.
2. Why has the number of non-permanent residents increased?
Statistics Canada publishes a breakdown of the number of non-permanent residents in its table 17-10-0121-01,3 although the decomposition begins only in 2021 Q3. Asylum claimants, numbering 289,047 in the most recent quarter, account for a little over 10% of the total stock. Slightly over half of these have work permits, a relatively small absolute number, and a very small number have study permits. Permit holders who are not asylum claimants, plus their family members, account for most of the NPRs.
Some of the over 2.5 million NPRs have work permits, some have study permits, some have both and some are family members or asylum seekers without permits. Only about 67% of the NPRs have work permits.
So why is it that the net number of non-permanent residents rose an astounding 804,690 in the most recent four quarters? There are two major reasons and they are fairly simple.
First, a growing number of Canadian businesses have come to realize they can reduce labour costs substantially by employing temporary foreign workers instead of permanent Canadian residents who would expect higher wages and, in some cases, better working conditions. The businesses lobbied the federal government to increase the number of work permits, saying they were suffering from a shortage of available workers, and the government complied. However, the unemployment rate reached a low of 4.9% in mid 2022 and rose to 5.5% by 2023 Q3. The job vacancy rate fell from 5.6% in mid 2022 to just 3.8% in the third quarter. If shortages were a serious problem in 2022 they are less so today.
Second, many Canadian universities and colleges, coping with budget cutbacks, realized they could increase their total tuition fee revenues substantially by ensuring study permits were available for foreign students. Canadian students are charged lower fees because the schools are heavily subsidized by Canadian taxpayers. But foreign students must pay “full fare” so they are quite lucrative for the schools. As did the businesses, schools lobbied the government successfully to increase the number of study permits allowed.
The result has been to add well over a million new NPRs to the Canadian population over the last two years. This sudden and unexpected increase in the number of people living temporarily in Canada has put considerable stress on the available housing stock, causing big rent hikes in urban areas, where the NPRs tend to locate. As noted, it has also been a factor in the recent decline of Canada’s GDP per capita, a concern among economists and policy-makers. So there would seem to be a good prima facie case for the government to reduce the number of NPRs by issuing fewer foreign worker and student permits.
3. Characteristics of non-permanent residents
A recent Statistics Canada study4 looked at the characteristics of NPRs in 2020 using census data and found that the stock of NPRs was a lot younger on average than the permanent resident population. NPRs worked more part-time jobs and in cases where they had full-time jobs, frequently had them for just part of the year. An approximate calculation using findings in the Statistics Canada study indicates the average hours worked per annum by NPRs were about 80% of those for PRs.5 They had a greater tendency to be overqualified for the jobs they worked in. There were more male (54%) than female (46%) NPRs in 2020. According to the study, 92% of NPRs resided in census metropolitan areas and 60% resided in Ontario or British Columbia. About 5% of NPRs could speak neither English nor French.
Unfortunately the Statistics Canada study says nothing about the earnings of NPRs. However, it does observe that temporary foreign workers are employed in a variety of occupations and industries, indicating the top ten occupations for NPRs were:
Nurse aides, orderlies and patient service associates,
Light duty cleaners,
Material handlers,
Labourers in food and beverage processing,
Transport truck drivers,
Food counter attendants, kitchen helpers and related support occupations,
Delivery service drivers and door-to-door distributors,
Retail salespersons and visual merchandisers,
Security guards and related security service occupations and
Other customer and information services representatives.
These various characteristics of the NPRs imply that their impact on GDP per capita is quite different from that of Canada’s PRs. Because they are younger on average than PRs, they boost the working-age share of Canada’s population, and they also had a higher employment rate (66% versus 57%) in 2020.6 Their average productivity is likely much lower though because it appears they tend to work primarily in labour-intensive industries and are in occupations paying relatively low wages per hour worked. In addition, they tend to work significantly fewer hours per annum than PRs. Overall the productivity and therefore per capita GDP of NPRs appears to be substantially smaller than that of PRs.
The findings from the Statistics Canada study must be taken with a grain of salt because it appears this was the first such study of its kind and was based on census data for the pandemic year 2020. The results may be less applicable to the post-pandemic years 2022 and 2023 when the number of NPRs was so much bigger. Going forward though, if the number of NPRs remains as high as in 20237 and indeed if it grows even larger, then Statistics Canada should look at ways of collecting more timely data on the characteristics of NPRs, and more economic data such as industry of employment and wage information. Perhaps the Labour Force Survey could be stratified differently to achieve this purpose, for example.
4. So how do changes in the number of non-permanent residents affect GDP per capita?
One can think of Canadian GDP as the sum of two parts, one attributable to PRs and the other to NPRs. Using the symbols ‘Y’ and ‘N’ to represent GDP and the population, we have the following expression for GDP per capita:
where the superscripts ‘p’ and ‘np’ stand for PRs and NPRs. This equation can be easily transformed to express GDP per capita as the weighted sum of the GDPs per capita of PRs and NPRs, where the weights are the corresponding shares of PRs and NPRs in the total population:
Representing the population shares as ‘wt’, we have:
Unfortunately it would be very difficult to estimate reliably the separate per capita GDPs for PRs and NPRs using existing data sources.8 However, one can explore alternative scenarios using different assumptions.
The evidence cited in the previous section suggests the GDP per capita generated by non-permanent residents is low compared to that of permanent residents. This belief starts from the fact that some non-permanent residents do not have work permits. Of the 65% that do, many work substantially less than a full year and many work in part-time jobs. As mentioned, on average they work roughly 20% fewer hours per period than PRs. The jobs they have tend to be ones requiring limited occupational skills, with relatively low wage rates. NPR workers are typically younger and therefore less experienced than the average PR workers, so they are likely to be nearer the bottom of their wage scales.
So we will consider four scenarios, each of which assumes the GDP per capita of NPRs is some fixed percentage of that of PRs. The assumed percentages will be 25%, 50%, 75% and 100%. Using the symbol ‘s’ to represent the percentage and substituting for the GDP per capita of NPRs gives the following equation:
Equation (4) is easily solved for per capita GDP of the PRs.
This will be used to look more closely at the historical record and then to estimate what Canada’s real GDP per capita might look like if the government addressed the issue by cutting back substantially on the number of NPRs accepted in Canada, returning gradually to the level that existed two years ago.
5. Historical scenarios
Canadians should be a lot more concerned about the evolution of the GDP per capita of its permanent residents than of its non-permanent ones. The number of NPRs is temporary, comparatively small and can be easily reduced (or increased) by policy action, while none of this is true for its PRs.
Chart 2 shows the 50-year time series for real GDP per capita of Canada’s PRs under the four scenarios. The black line (assumption 4) shows the GDP per capita of PRs when the NPR GDP per capita is assumed to be the same as that of the PRs. This is the same as the total GDP per capita line everyone is familiar with, showing a precipitous drop after 2022 Q2.
The four cases overlap greatly in the 1970s, 80s and 90s because the relative number of NPRs was quite small then. As the relative number of NPRs has increased, the four cases got wider apart.

The blue, red and green lines show the GDP per capita of PRs under the three alternative assumptions that the GDP per capita of NPRs is just 25% (blue), or 50% (red) or 75% (green) of that for PRs. As indicated by equation (5), the lower is the assumed GDP per capita of NPRs relative to that of PRs, the higher is the implied GDP per capita of PRs, given Canada’s total GDP per capita.
These scenarios suggest that the sharp drop recently in GDP per capita is due, to a considerable extent, to the fact that the higher number of NPRs, with their presumed lower output per person, account for a substantial part of the overall decline. To address the issue, the number of NPRs could simply be brought back down to a smaller level.
6. Gradual NPR cutback scenarios
Chart 3 explores what the next two years might look like under different assumptions. The scenarios are all based on the same assumptions about the growth of real GDP and the permanent resident population. The variation comes from alternative assumptions about the non-permanent resident population.
It is assumed GDP will grow in 2024 and 2025 as projected in Finance Minister Chrystia Freeland’s Economic Statement delivered on November 21, 2023. The growth rates are 0.4% in 2024 and 2.2% in 2025.9 It is also assumed the permanent resident population will grow at a steady 1.3% annual rate, which is the average growth observed over the five years to 2023 Q3.
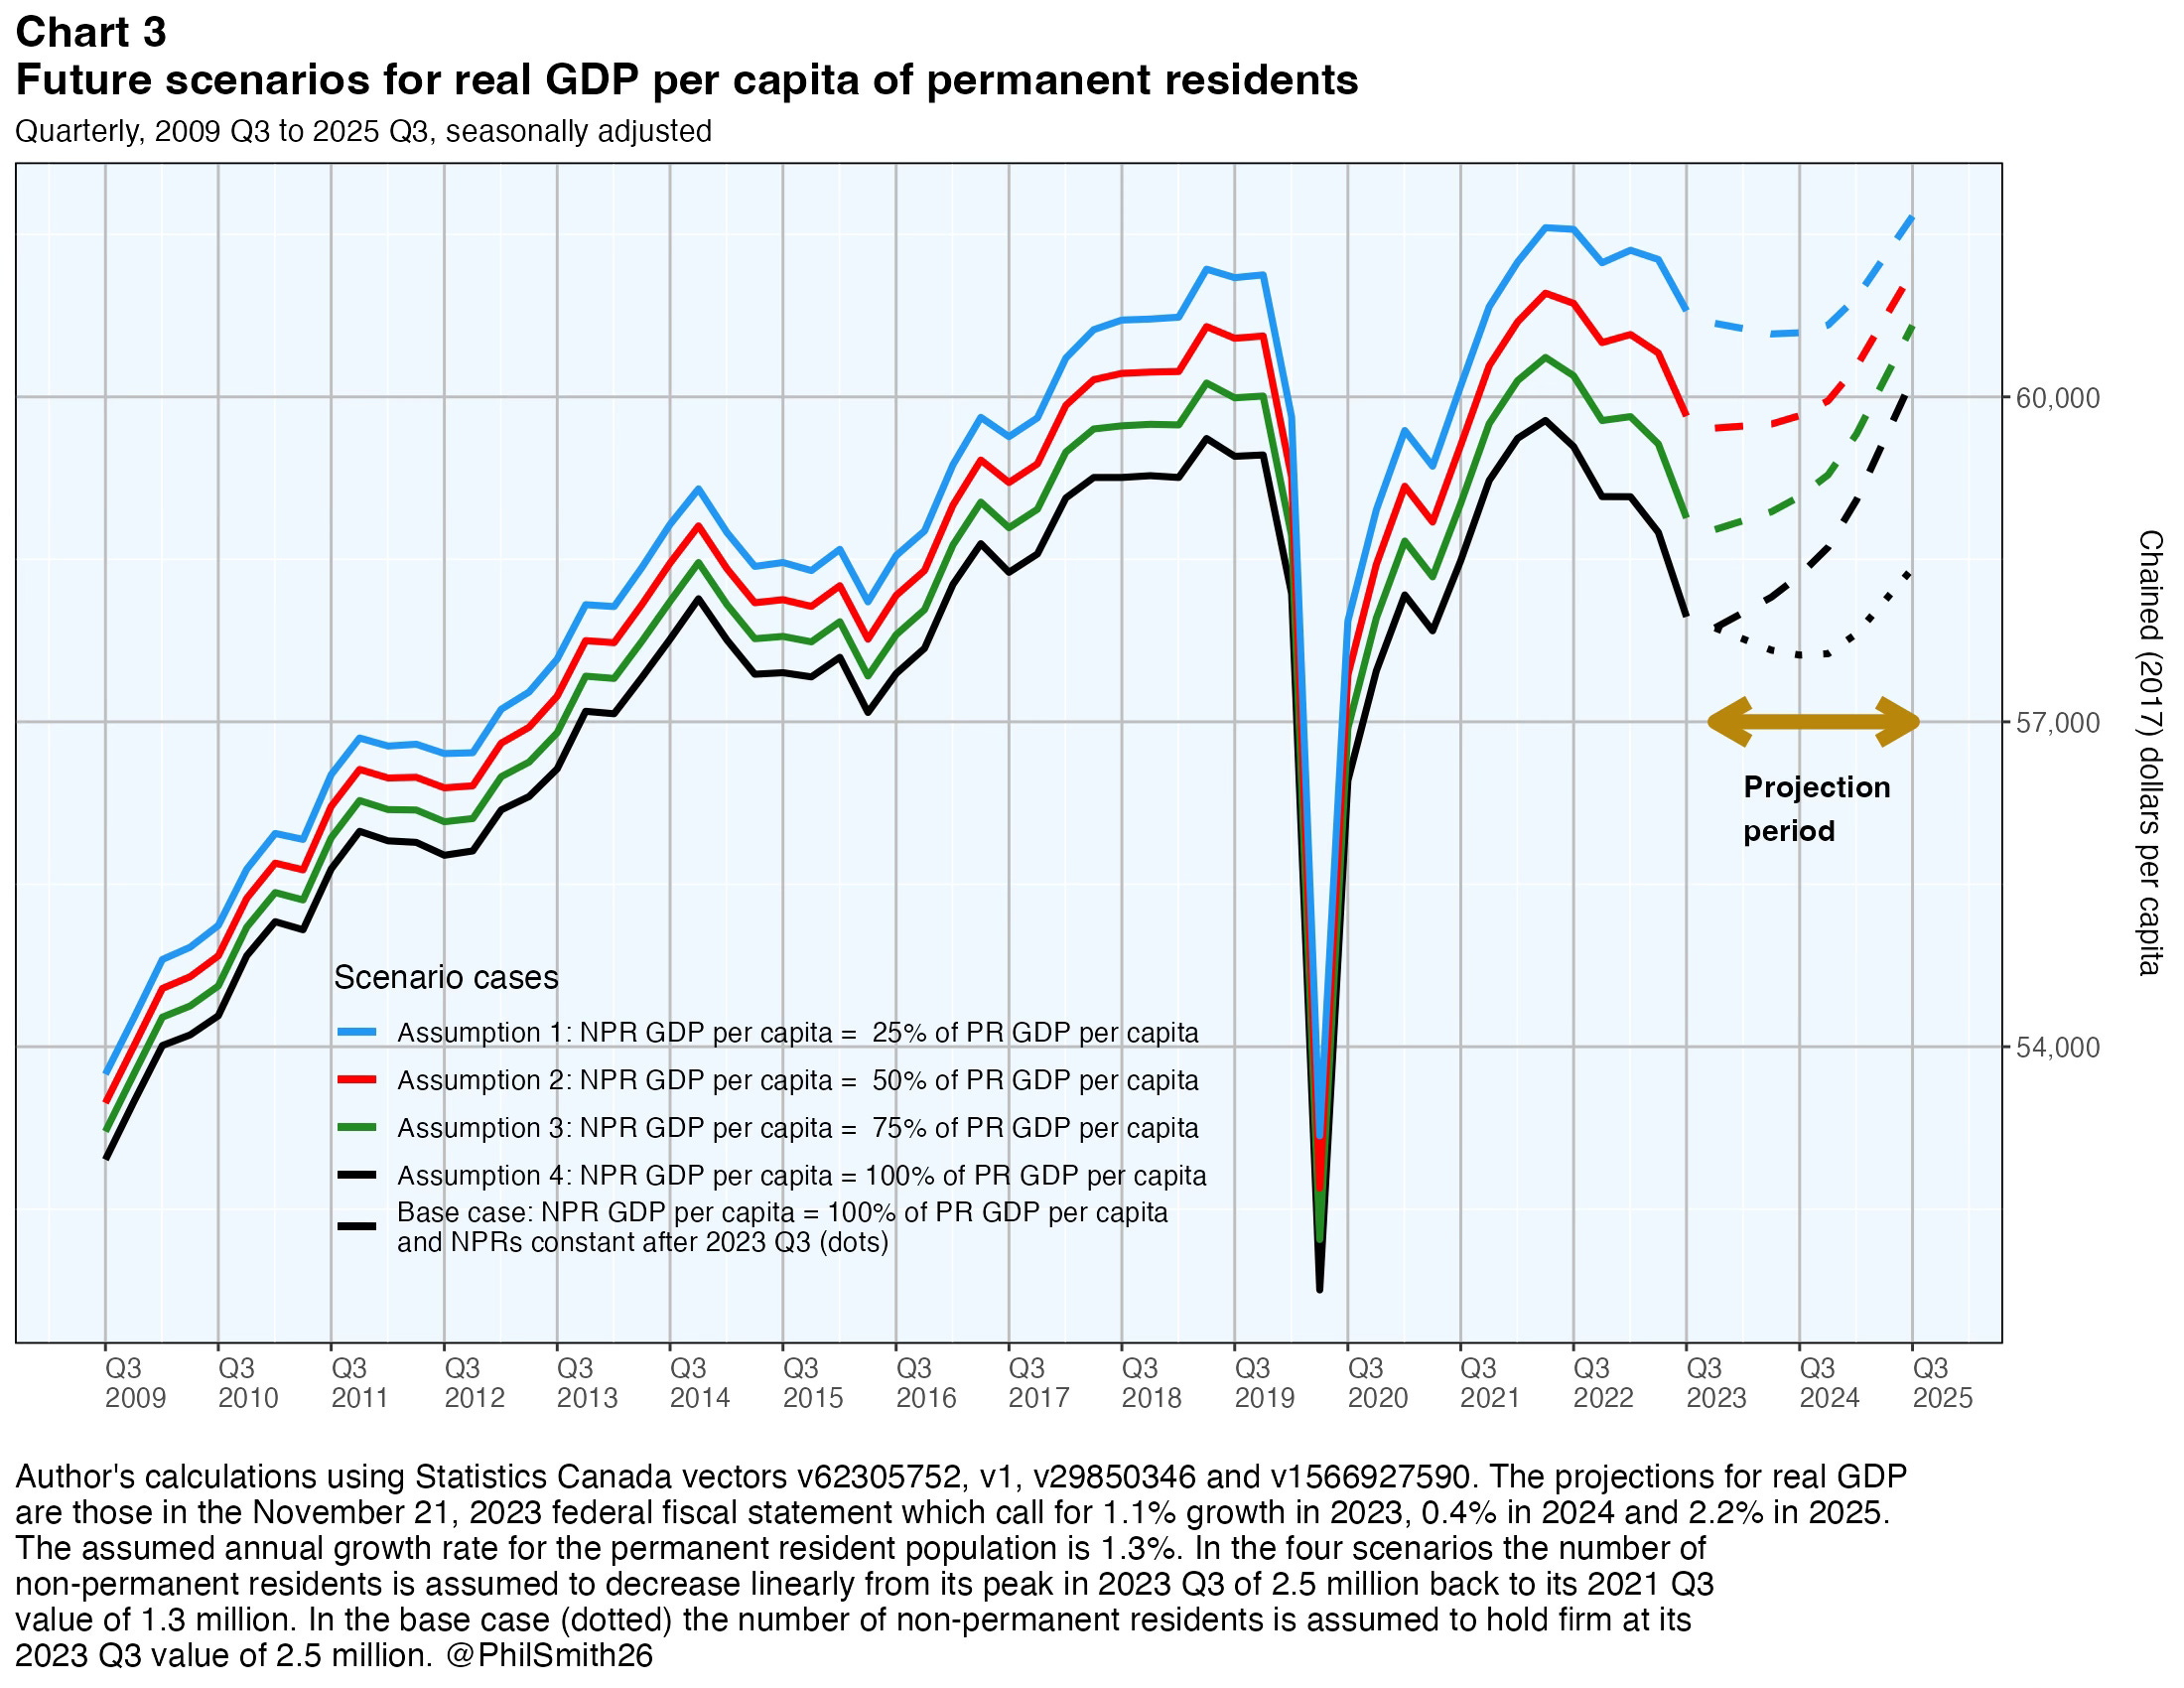
The base case scenario (black line with dots extension) in Chart 3 assumes the status quo will continue: in the next two years the number of NPRs will remain fixed at the 2023 Q3 level of 2,511,437 persons. The scenario also pegs the GDP per capita of NPRs at 100% of that for PRs. In 2024, with no further growth in NPRs but growth in the number of PRs exceeding that of GDP, GDP per capita of PRs continues to decline, although at a slower pace than in 2023. In 2025, as the growth of GDP picks up and exceeds population growth, the GDP per capita of PRs finally starts to rise again but remains well below its previous peak.
Scenarios 1 (blue line), 2 (red line), 3 (green line) and 4 (black line) make the different assumption that policy action will be taken to reduce the number of NPRs. Specifically it is assumed the number will decrease linearly from its 2023 Q3 level of 2,511,437 back to its 2021 Q2 level of 1,305,206, starting in 2024 Q1 and ending in 2025 Q3. Under this assumption, and continuing to assume the real GDP and PR growth rates mentioned earlier, the same four alternative scenarios discussed in section 5 above are examined. Equation (5) is used to calculate the implied GDP per capita for permanent Canadian residents and this is plotted. In each of these scenarios GDP per capita of PRs exceeds its previous mid-2022 peak by or before 2025 Q3.
Comparing the four future scenarios, the basic message is that if one accepts that the GDP per capita of NPRs is likely much smaller than that of PRs, then the sharp drop in overall GDP per capita is, to a considerable extent though not entirely, attributable to the surge in the NPR population.
7. Conclusions
Canada’s productivity performance, as measured by the ratio of real GDP to total hours worked in the business sector, has been poor in the last two years.10 This adverse factor combined with the speeding up of retirements in the baby boom generation has weighed heavily on economic growth. At the same time our population has grown extraordinarily quickly due to an influx of non-permanent residents. The result has been a marked decline in the GDP-to-population ratio, a time series that many economists consider a good indicator of Canadians’ well-being.
There are a number of policy actions Canadian governments can take aimed at improving productivity and raising GDP per capita. This paper has explored one area in particular: how the rising share of NPRs in the population is affecting the GDP-to-population ratio. It is argued that unless something is done to reduce the number of NPRs significantly, a recovery of the ratio to anywhere near its mid-2022 peak level is unlikely until well beyond 2025. It would undoubtedly be painful to some businesses and educational institutions if the allowable number of work and study permits was substantially cut back, but this is what is needed if the housing shortage is to be alleviated and GDP per capita is to be restored to a more positive trend. With unemployment currently edging upward and the job vacancy rate downward, now is a good time to begin the change.
Among these other factors are ‘externalities’ such as air, water, land and noise pollution; global warming and its effects on climate; the distribution of income across the population; and the state of ‘social capital’ within the country and more broadly within the world as a whole. Statistics Canada has an interesting Quality of Life Hub that ties the key elements of well-being together.
See “What drives changes in real GDP per capita?” on Substack, September 12, 2023.
It is challenging for Statistics Canada to estimate the stock of NPRs in Canada at any specific point in time. Inflows can be counted with no great difficulty, but the measurement of outflows is more problematic. Administrative records indicate when each work or study permit expires, but there is no direct way to check whether an individual NPR did, in fact, depart the country before that expiry date.
The agency says the following about its estimates of non-permanent residents: “A non-permanent resident refers to a person from another country with a usual place of residence in Canada and who has a work or study permit or who has claimed refugee status (asylum claimant). Family members living with work or study permit holders are also included unless these family members are already Canadian citizens, landed immigrants (permanent residents), or non-permanent residents themselves.”
“This is an estimate of the number of non-permanent residents in Canada, and differs from the number of asylum claimants and temporary residents from the Department of Immigration Refugees and Citizenship Canada (IRCC). Care should be taken to consider the differences in methods and reference dates when comparing data from IRCC with Statistics Canada demographic estimates. The two data sources are not fully comparable.”
“The non-permanent resident types are mutually exclusive and are derived in the following order of classification: asylum claimants then permit holders. Consequently, there are no asylum claimants among the permit holders types.”
Statistics Canada recently published a study of the socio-demographic characteristics of non-permanent residents using data from the 2021 census. See Catherine Tuey and Nicolas Bastien, “Non-permanent residents in Canada: Portrait of a growing population from the 2021 Census”, 75-006-X, June 2023.
The Statistics Canada study reports that in 2020 37.0% of working NPRs were employed full-time for a full year, 32.1% full-time for less than a full year, 6.6% part-time for a full year and 24.3% part-time for less than a full year. The corresponding percentages for working PRs were 53.7%, 25.0%, 5.6% and 15.7%. Applying some simple assumptions as to how many hours were worked full- or part-time within each group, the average number of hours worked per annum by working NPRs is roughly 80% of that for working PRs.
This may have been affected by the particular circumstances of 2020, when the pandemic struck, big layoffs occurred and special government transfer payments were introduced for laid off employees and businesses. As shown in Chart 1, the number of NPRs dropped somewhat in 2020 as a result of international travel restrictions.
As noted in the text, NPRs represented 5.5% of the population in the latest quarter. This is a significant number, larger than the number of Aboriginal people in Canada for example.
A general equilibrium analysis would be preferred, estimating not just the direct impact of the wages earned by the NPRs on GDP, but also the follow-on effects on the wages of PRs and on corporate profits and unincorporated business income.
A quarterly growth path of 0.1%, 0.1%, 0.1%, 0.2%, 0.3%, 0.6%, 0.8%, 0.8% and 0.9% for the quarters 2023 Q4 through 2025 Q4. This path yields the annual growth rates of 0.4% and 2.2% in 2024 and 2025.
For more on Canada’s recent labour productivity performance see “Interpreting recent productivity performance in Canada” on Substack, August 11, 2023.
Thanks for your question.
My base case scenario, shown as the dotted line, assumes GDP growth of 0.4% and 2.2%, PR growth of 1.3% and NPR growth of 0% (i.e. NPRs are fixed at 2.5 million).
The other four cases all assume the linear decline in the number of NPRs from 2.5 million to 1.3 million, but they vary in the assumption about the unknown true value of GDP per capita of NPRs. We don't know what the GDP per capita of NPRs is, but we believe it is probably less than 100% of the GDP per capita of PRs.
Given our 1.3% annual growth assumption for PRs and given the scenarios' negative growth path for NPRs, we can easily calculate the future values of total population, which are the same in all four scenarios. Given our forecast for real GDP of 0.4% and 2.2%, we know the future values of total GDP as well. So in my scenarios we know total GDP per capita.
The question I am trying to explore is this: What is the future path of per capita GDP of PRs? Why am I interested in this? Because I think it makes a big difference how much of our current "declining total GDP per capita" dilemma in Canada is because of the surge in the count of NPRs, which is something we could easily fix, and how much is something affecting the GDP per capita of our PRs, which of course is a much deeper problem not so easily fixed. If NPRs are much less productive, on average, than PRs, then the dip in GDP per capita of PRs was relatively mild (blue dashed line) and that's a good thing. If NPRs are just as productive as PRs (black dashed line), then the dip was much deeper and we have a bigger problem.
The comparison of the black dashed line and the black dotted line shows that the number of NPRs in the future scenarios makes a big difference. But we know nothing of what the government's NPR work permits policy will be in 2024 and 2025 (at least I myself know nothing about it). We know what their GDP growth expectations are, but we do not know their plans for NPR work permits. Indeed, we don't know their total population growth assumption either (or at any rate I did not find it in their Economic Statement document).
I hope this addresses your question adequately, but if not please continue the conversation.
Philip
Wow! Thank you for this and all the material you’ve made available. You’ve done a good job explaining the relationship between productivity and labour is affected by immigration, aided by the fact of good data. I don’t think data on financing is as good as for other factors but why couldn’t it be? OSFI has, or could have, real time reporting on commercial loan and deposit balances in all the big banks. It could also have anonymized reporting by NAICS code for the key financial metrics (leverage, debt service cover etc) of every industrial sector by size of enterprise so that policy makers could understand better what is going on with respect to business investment. If the Canadian financial sector were not so dominated by the big banks, for whom commercial lending is their least favourite line of business, maybe alternative capital providers would fill the large gap between the degree of support SMEs in other OECD countries get (especially the US) compared to that which SMEs in Canada receive. (See the annual report on Financing SMEs and Entrepreneurs: An OECD Scoreboard). Speaking of which, have you ever looked at this report. Canada’s performance is an outlier (to the negative) and has been for longer than the GDP productivity stats. I would really appreciate if someone with your background took a look. Cheers, Guy