Real GDP per capita vs real HDI per capita since 2019
Why have they evolved so differently? What are the implications?
There has been a great deal of focus on the downward trend in Canada’s real GDP per capita in the past two years. And for good reason. This indicator is normally a sound overall barometer of Canadian economic welfare.1 But there is another good measure for this same purpose — real household disposable income per capita — and it gives a very different picture. This paper explores the reasons for this difference and discusses the implications.
Real gross domestic product per capita
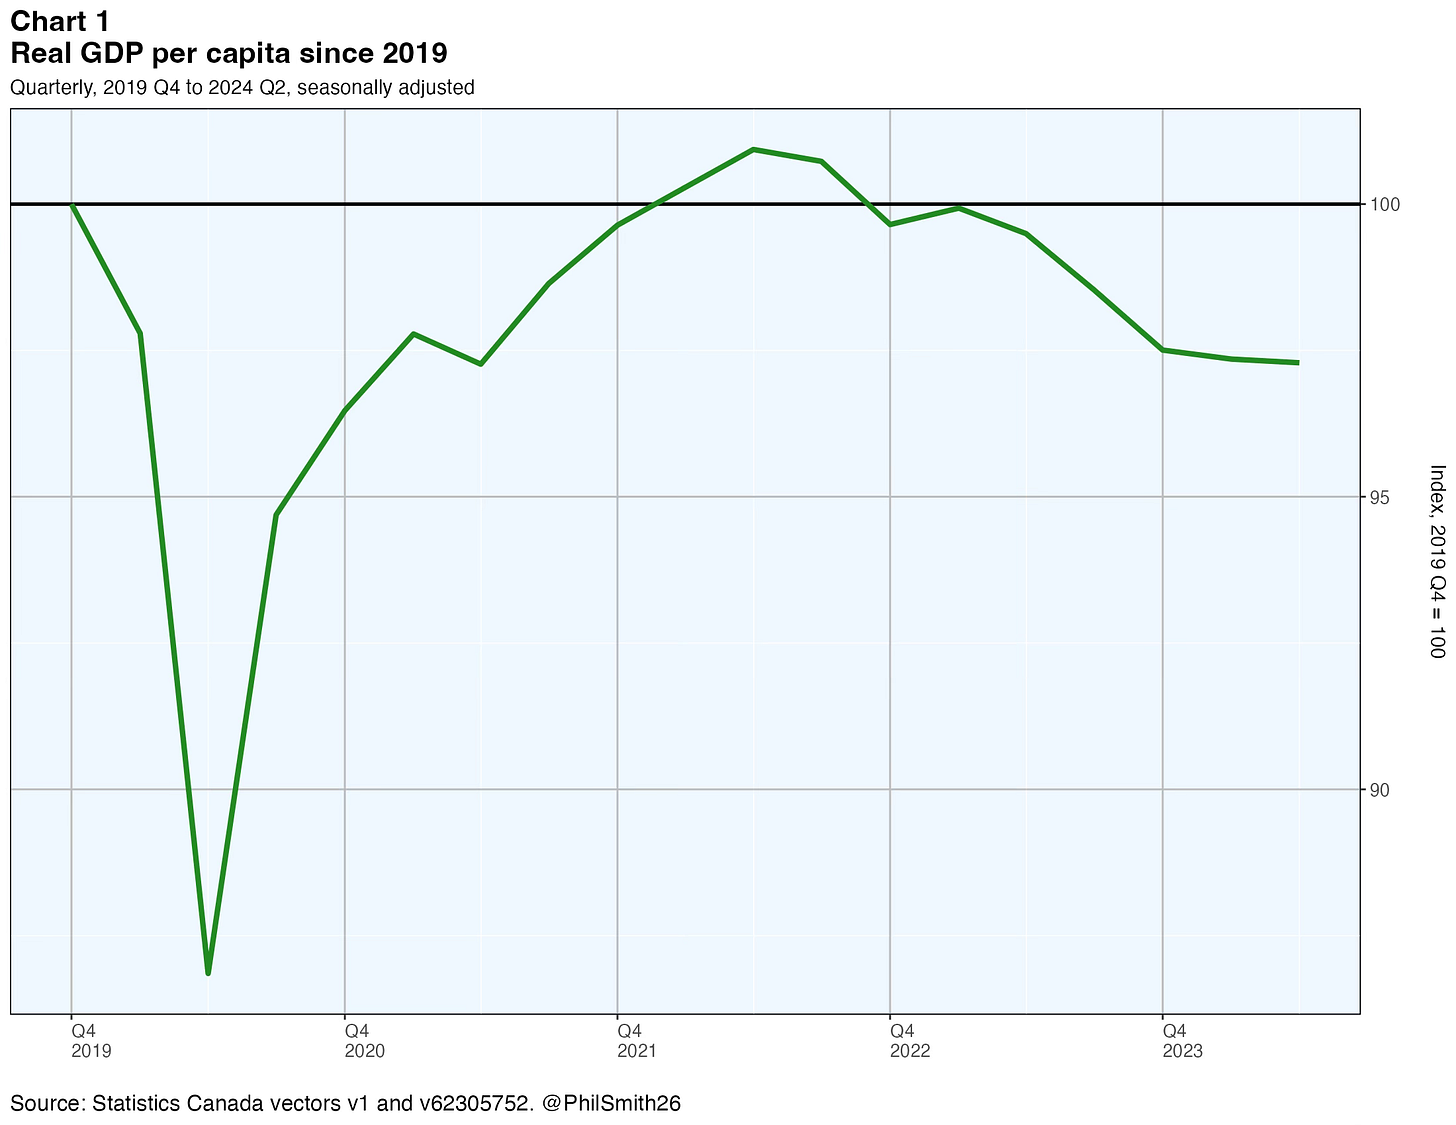
Real GDP is the inflation-adjusted value of total production (‘value added’) or equivalently, total real income generated by factors of production in Canada. Dividing by population yields the economic welfare indicator just mentioned. Chart 1 shows the path taken by real GDP per capita since the end of 2019. The ratio plunged in the first half of 2020 when the pandemic struck, but it recovered fairly well and exceeded the pre-pandemic level in 2022 Q1. Thereafter it peaked in mid 2022 and has been on a decline ever since. It was 2.7% below the pre-pandemic level in 2024 Q2.
Real household disposable income per capita
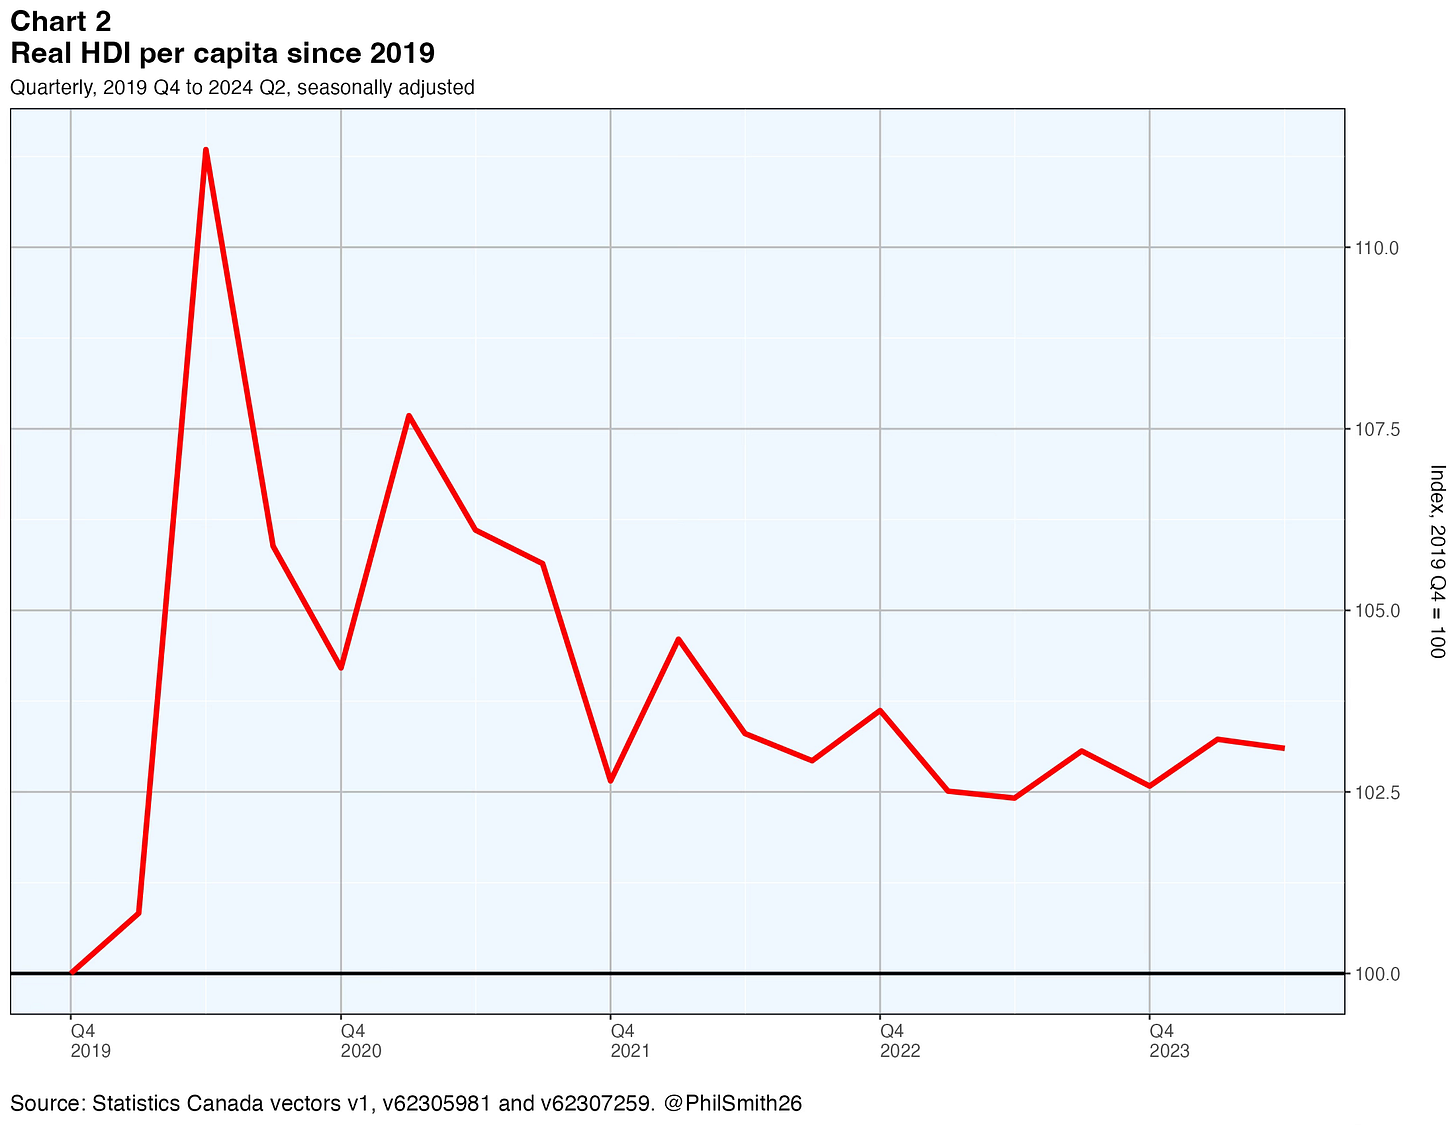
Real household disposable income (HDI) is quite different from real GDP. It pertains to only one of the five sectors identified in the national accounts, households.2 HDI is the sum of incomes earned by Canadian households (labour income, unincorporated business income and net property income) plus transfers received from other sectors (principally the government sector), minus transfers paid to other sectors (again, mainly to the government sector). It is divided by the chained price index for household final consumption expenditures3 to obtain real HDI and then divided by population. Chart 2 shows this indicator.
This indicator tells a quite different story than real GDP per capita. Rather than plunging when the pandemic started, it leapt higher as governments quickly introduced temporary but very big transfer programs to protect households from the consequent job and unincorporated business income losses.4 These programs were phased out gradually as the economy recovered. By 2022 the economy was booming and the unemployment rate reached an all-time low of 4.8% at mid-year. High and rising employment boosted household disposable income considerably, but this was offset by a steep and unexpected rise in the rate of consumer price inflation. A rapid increase in Canada’s population in 2022 and an even larger one in 2023 and the first half of 2024 was an additional factor holding down real HDI per capita. Nevertheless the indicator remained 3.1% above its pre-pandemic level in 2024 Q2.
How to reconcile these two economic welfare measures?
Table 1 shows, for selected quarters, the accounting links between GDP and HDI, both measured at current prices.
Nominal GDP grew 27.9% between 2019 Q4 and 2024 Q2 while HDI increased 29.2% in the same period. This difference of 1.3 percentage points in favour of HDI explains about a fifth of the differential in real growth between GDP and HDI depicted in Charts 1 and 2 (-2.7% versus 3.1%). The remaining four fifths are accounted for by the price indexes applicable to GDP and HDI, shown in Table 2.
HDI is an income measure and we convert it to real terms using an index of the prices for all the types of goods and services that households typically spend their income on. Expenditure-based GDP is a measure of final expenditure on distinct categories of spending for which corresponding price indexes are available. Household expenditure on consumer products is deflated by consumer product price indexes, business investment by price indexes for new capital assets of various kinds, and exports and imports by price indexes for the products exported and imported.
To calculate real HDI we use the first line of Table 2, indicating the purchasing power of disposable income. Its breakdown into aggregate goods and services components is also shown, in lines 2 to 6. To calculate real GDP we deflate its components using all of the indexes shown in Table 2. Its largest component, currently accounting for 54% of GDP, is household final consumption expenditure. The rise in prices for this component between 2019 Q4 and 2024 Q2 was 15.6% and this was the lowest price increase of all the GDP components shown in the table. The increases for the other GDP price indexes rose more rapidly, most notably for residential investment and exports.
Ceteris paribus, rising export prices imply lower real GDP.5 But if the focus is on Canada-wide real income, higher export prices imply more Canadian purchasing power abroad per dollar of exports. As our export prices rise or fall relative to the prices we pay for imported products, we are correspondingly better or worse off. The ratio of Canada’s export prices to its import prices is called the terms of trade (ToT).6 The national accounts include an additional aggregate called real gross domestic income (GDI), equal to real GDP minus the ToT effect. The effect is the difference between the trade balance as defined for purposes of measuring GDP — exports deflated by an export price index minus imports deflated by an import price index — and the trade balance defined as the nominal trade balance deflated by an index of domestic expenditure prices. The latter represents Canada’s net real income from international trade.
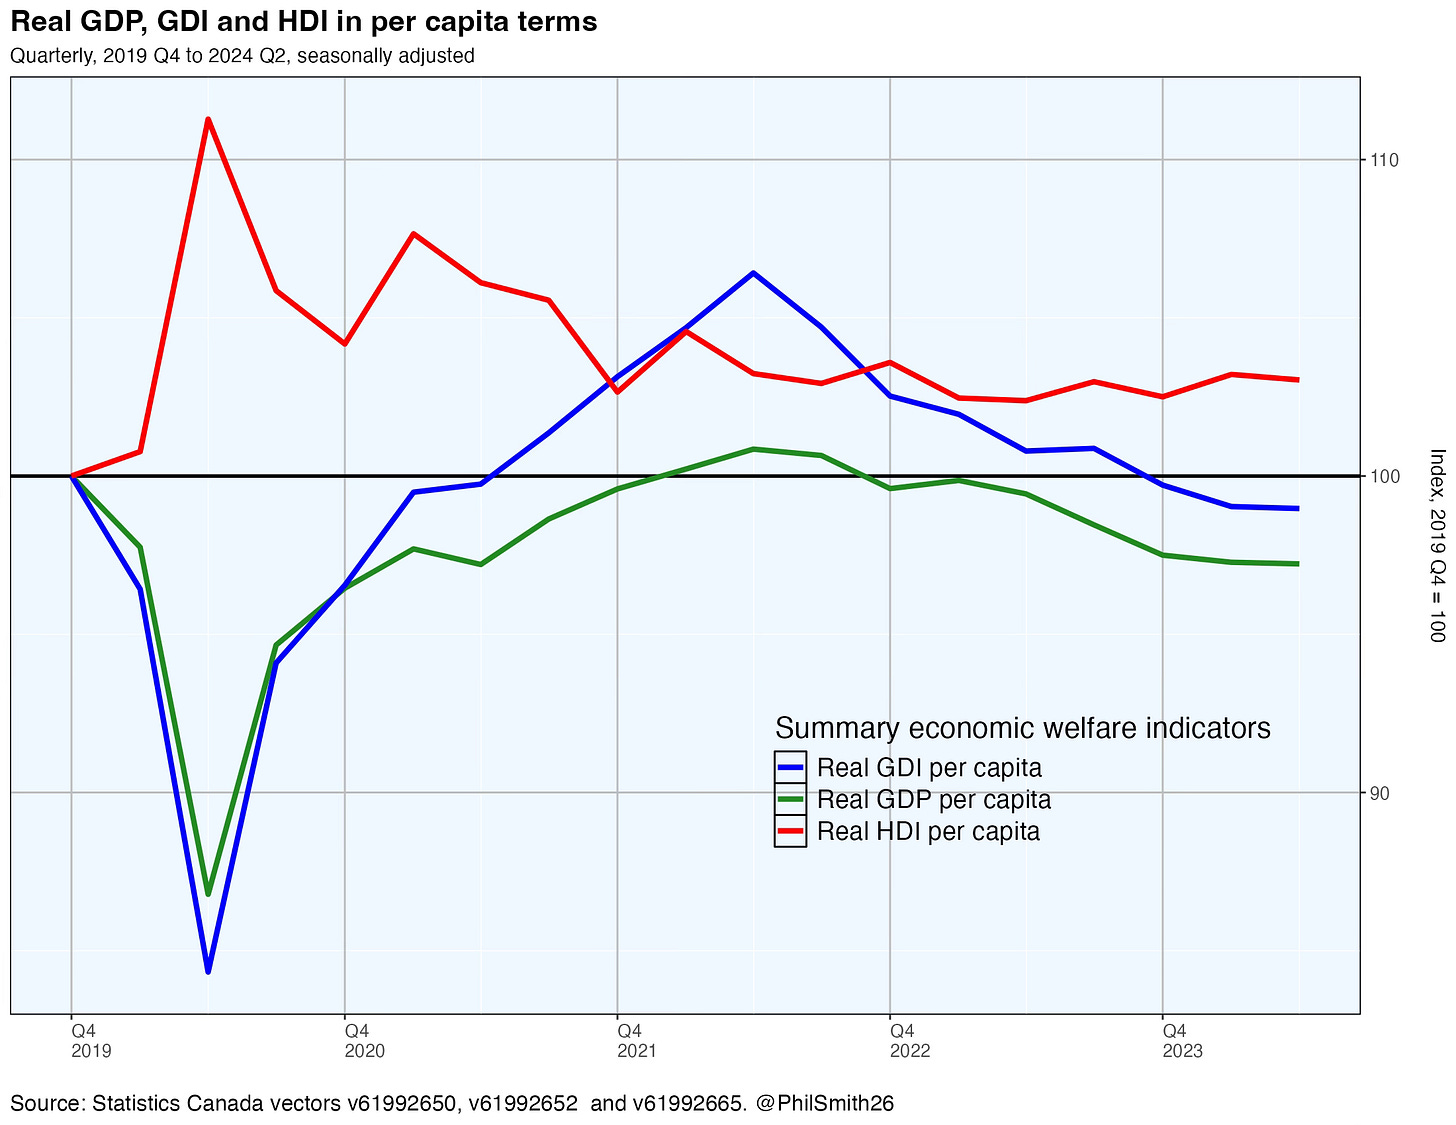
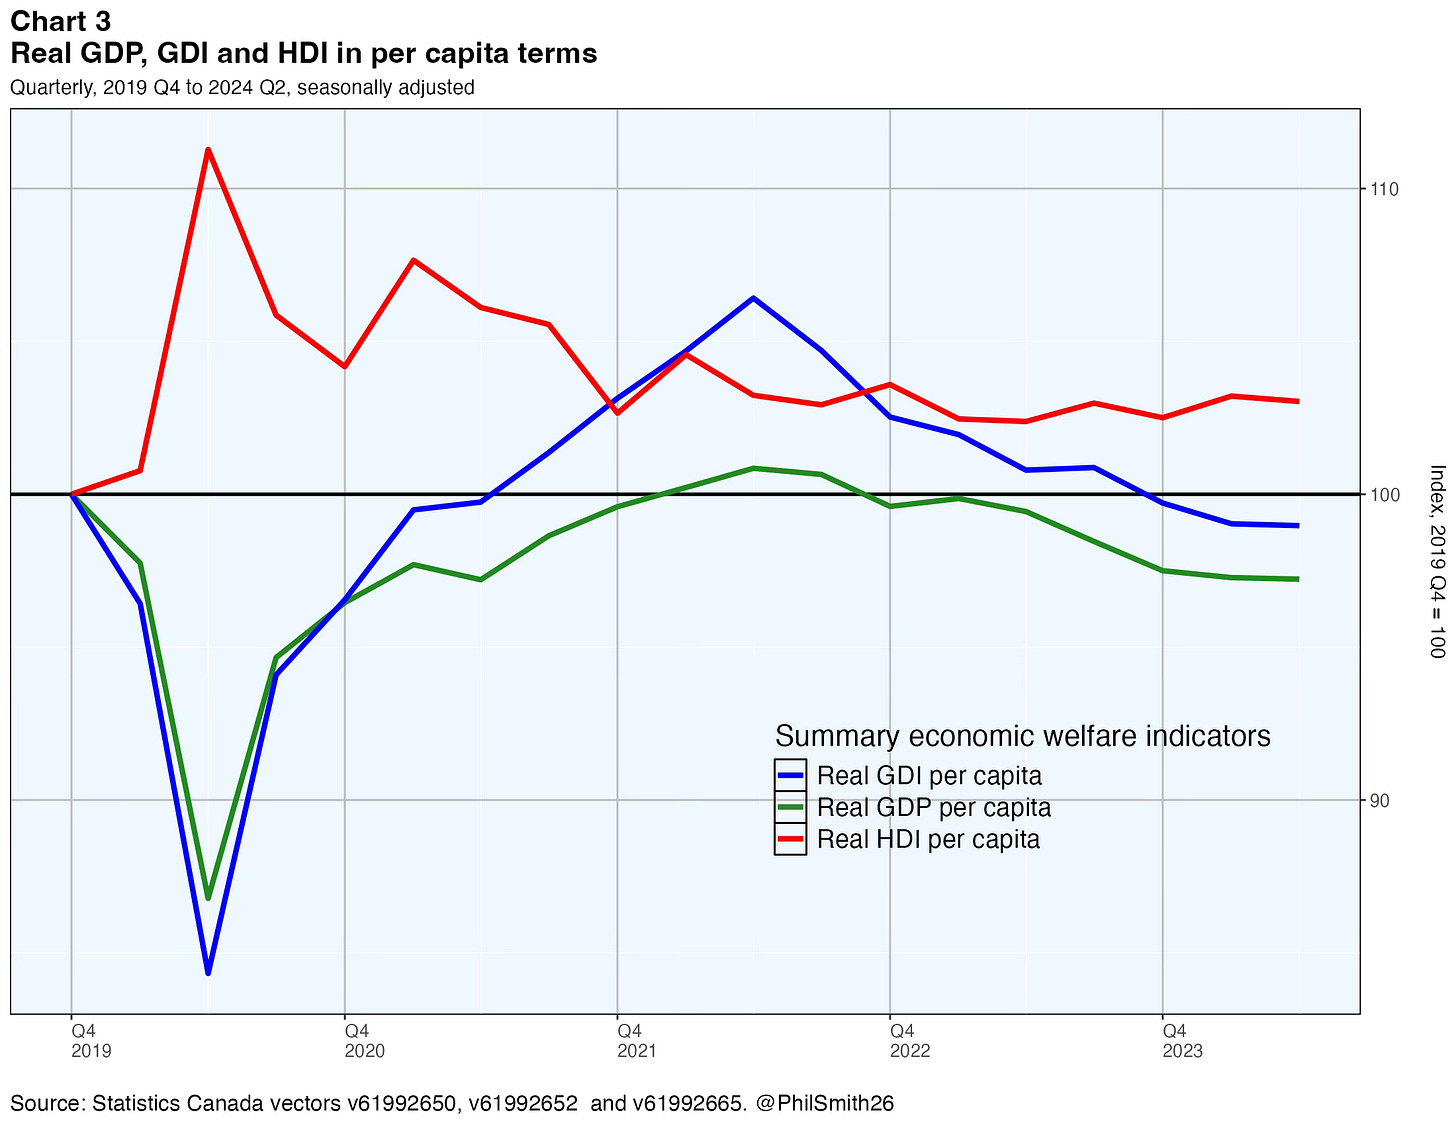
Chart 3 compares real GDI per capita to the other two per capita aggregates discussed previously.7 Real GDI per capita (the blue line) was 1.0% below its pre-pandemic level in 2024 Q2. It implies Canada’s economic welfare was closer to the pre-pandemic level at that date than real GDP per capita indicates, the reason being that while export prices rose 28% over the full 18-quarter period, import prices increased just 20.5%. There was a ToT gain. Notice as well that the index for real GDI per capita was well above both the other two indicators in mid 2022, when the post-pandemic pace of economic expansion was at its peak. This was because world prices for many of Canada’s most important exported products, such as oil and gas, grains, metals, minerals and forestry products, had risen a lot more than our import prices, which are primarily for consumer goods and services purchased from the United States. World commodity prices have decreased since mid 2022, but not enough to bring the path for real GDI per capita below that for real GDP per capita.
So what explains the remaining gap between real HDI per capita and the other two measures in 2024 Q2? It is the rapid rate of price increase for capital assets, seen in Table 2. Prices for residential construction, which includes home renovations and real estate commissions as well as construction per se, rose 42% over the 18-quarter period while non-residential investment prices increased 24.2%.
Conclusions
Real HDI per capita is an appealing economic welfare measure because it is easy for all Canadians to identify with. Moreover, although the indicator itself is a simple average, it is possible to explore its distribution across the population, which is not the case for real GDP per capita.8 Real GDI per capita, while more appropriate as a summary economic welfare measure than real GDP per capita, is not as simple for most Canadians to understand as real HDI per capita. It differs from the HDI measure in that it has a longer-term focus. A prosperous society requires continuing expenditures on capital goods and services, not just on consumer products, and both GDI and GDP per capita include the former along with the latter. Investment spending is needed to replace depreciating capital assets without which Canada’s production capacity, and therefore its real HDI per capita, would eventually decrease. Canada also requires investment spending beyond simple replacement investment if it is to become more productive and grow its economy.
Accordingly, both real HDI per capita and real GDI per capita should be considered good summary measures of economic welfare, but it must be kept in mind that the former is really a shorter-term indicator while the latter is the one that matters most in the longer-term.9 Canadians are fortunate that their real disposable incomes, on average, have not declined despite the pandemic in 2020-2021 and the slower pace of economic growth in recent quarters. But the falling trends in real GDI and GDP per capita over the last two years do not augur well for the future.
Annex
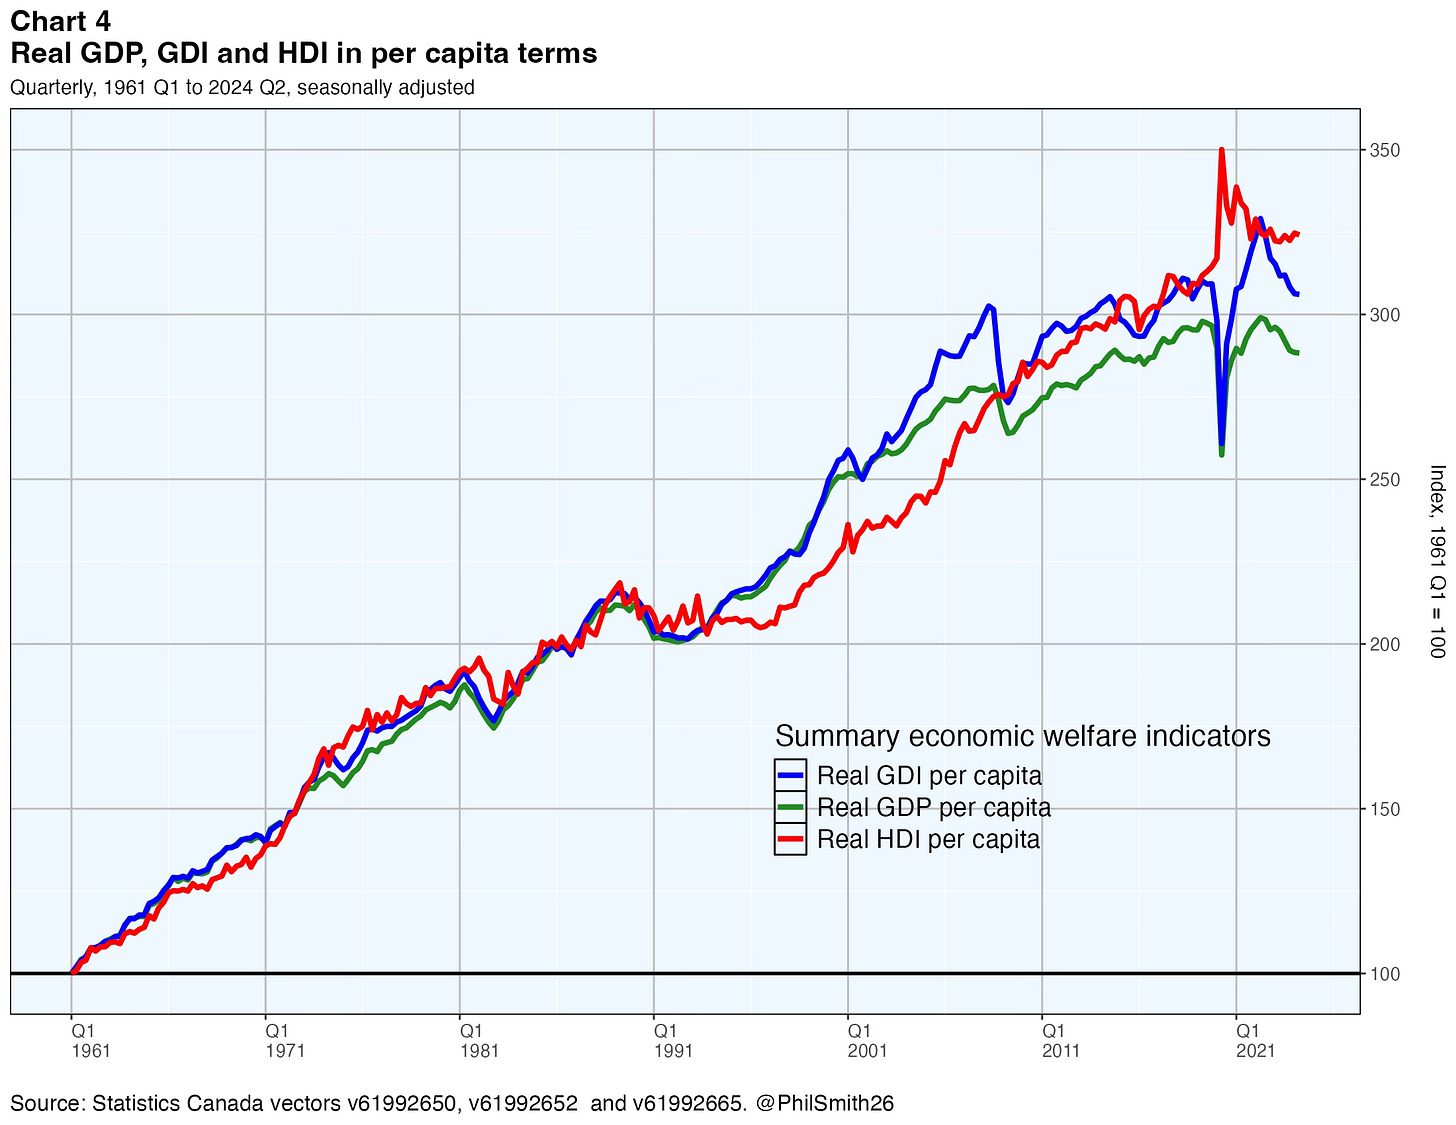
After the initial posting of this article, a reader suggested I include a chart showing the longer-term history of the three indicators. The result is in Chart 4 below.
This chart can be regarded as consisting of three parts. The first part extends from 1961 Q1 to 1994 Q1, when the three indicators tracked each other fairly closely. At the end of that sub-period the three lines came together, essentially rebasing the indexes to the same value around 1994 Q1. The second part extends from 1994 Q1 to 2009 Q1 during which the three indicators took different paths while again coming together eventually and, in effect, rebasing the indexes once more. Both of the two period end-points were near the trough of a preceding recession. The final part saw real GDP per capita trending below the other two and by 2024 Q2 the divergence among the three indicators was the greatest it has ever been. A pessimist might worry it will take another recession to bring them back together again.
What is called “economic welfare” in this paper is not the whole story, of course. Well-being is also affected by other factors, notably externalities such as pollution, the availability of leisure time, income distribution, life expectancy and the degree of social harmony. But these additional factors are not the subject addressed here.
The others are corporations, governments, non-residents and non-profit institutions serving households.
This price index comes from the national accounts. It is broadly similar to the CPI, although its treatment of housing prices is quite different and it updates the ‘basket’ quarterly rather than annually. The chained price index for household final consumption expenditures is an indicator of changes in the purchasing power of the consumer’s dollar, so when household income is divided by this price index a measure of ‘real’ income is obtained.
Corporations also received big subsidies, but while the unincorporated business subsidies gave a boost to HDI, the corporate subsidies had little effect on production and hence on GDP.
In other words, if exports measured in Canadian dollars remained unchanged from one period to the next while the prices of the goods and services exported rose 5%, then real exports would have decreased 5%. The dollars received from other countries in exchange for our exports would represent fewer real goods and services exported than in the previous period.
For more on the terms of trade see my paper “The Terms of Trade” (May 2023), here on Substack.
Chart 4 in the Annex plots the three indicators again, over a much longer period, for reference.
Statistics Canada publishes household disposable income on a national accounts basis by quintile in table 36-10-0587-01. Personal income tax data from the Canada Revenue Agency can also be used to explore the income distribution by smaller gradations.
It should also be noted that over a lengthy period of time real GDI per capita and real GDP per capita are likely to give very similar implications. Note though that the long-term trend in Canada’s terms of trade has been one of gains rather than losses.




This is a thoughtful comment. If we are focussed on policies for voters/households, HDI has real merit
I woud kindly ask if PPP adjustment is included in real GDP per capita calculation, and if so, would it lead to significant changes, thanks