
Producing linked quarterly real GDP-by-industry statistics from 1946 to date
Success, but with important caveats

Statistics Canada releases estimates of real GDP-by-industry every month. Each release provides detail for 288 industries and aggregates and the estimates begin in January 1997. But what about the years prior to 1997?
Statistics Canada did, in fact, produce monthly estimates of real GDP-by-industry before 1997. But those estimates are not fully consistent with those that start in 1997, so they are not part of the current data set which is released in Statistics Canada table 36-10-0434-01. They are, however, available in several other `archived` Statistics Canada tables, notably 36-10-0390-01, 36-10-0392-01, 36-10-0379-01 and 36-10-0383-01. In this paper I refer to these as the five basic tables.
The tables can be used to link industry time series spanning four distinct periods which are:
(1) 1946 Q1 to 1960 Q41
(2) 1961 Q1 to 1980 Q4
(3) 1981 Q1 to 1996 Q4
(4) 1997 Q1 to date.
When a specific time series suffers from linkage problems, therefore, those problems will occur at the dates 1961 Q1, 1981 Q1 and 1997 Q1.
Why are the archived tables not integrated with the current table (36-10-0434-01) so users of the statistics can benefit from longer time series? There are many reasons. One relates to the fact that the definition of GDP changed somewhat when the United Nations adopted updated System of National Accounts standards for GDP in 2008. Another is connected to the adoption of the harmonized North American Industry Classification System (NAICS) by Canada, the United States and Mexico in 1997 and the five-year cycle of updates to the classification since then. This classification system is the basis for the industry breakdown for monthly real GDP-by-industry as it is currently estimated. The classifications that were used prior to 1997 were substantially different and less detailed. A third reason is that the quality and detail of the archived estimates are substantially lower than those of the post 1997 ones since they were not benchmarked to reliable supply and use tables like the current ones are. And finally, there is also the most basic reason that it would be both costly and risky to attempt an integration project of the kind discussed here. If Statistics Canada did undertake such a project, the agency might well conclude, in the end, not to publish the linked statistics because in its judgement they might lack sufficient reliability and consistency to warrant the agency’s official seal of approval.
In this paper I take a crack at addressing this problem. I present linked quarterly real GDP-by-industry time series for about 40 industry categories extending all the way back to 1946. These linked data were not costly for me to produce and they have lots of caveats, which I will outline below. They are not the sort of time series that Statistics Canada would normally want to release and they certainly do not have the agency’s seal of approval. They are not official statistics. If Statistics Canada itself did this work, I have no doubt they would do a better job. Nevertheless I think my results are useful for some purposes — as long as the forewarnings noted in this paper are kept in mind. You can find the linked statistics in spreadsheet files here.
Background
Statistics Canada received a large budget increase from the government in 1997 to enable it to produce reliable and detailed annual supply and use statistics for gross domestic product (GDP) by province and territory. The data were to be used, and still are, to calculate fair shares of the revenue from the then-new Harmonized Sales Tax (HST), collected by the Canada Revenue Agency, among the participating Canadian governments. Since the tax is a value-added tax, the revenue shares are quite different from what they would be with a simple retail sales tax. Detailed annual supply and use tables for each province and territory, articulating interprovincial trade flows as well as within-province production and consumption, allow the proper calculations. Officials from the participating governments can see the detailed statistics and verify for themselves the correctness of their government’s share calculation and the driving factors explaining it.
This common approach to revenue allocation has proven to be quite successful. It relieves businesses from some of the reporting burden they would otherwise have to bear. The new statistics also provide a rich economic database that can be used for many other purposes. They form the benchmarks for Canada’s entire system of national accounts.
Statistics Canada produced real value-added-by-industry statistics long before the new supply and use statistics, but they were less reliable, did not cover some parts of the services sector very well and lacked regional detail. The new HST-related supply and use tables provided an opportunity for the agency to restructure its real-value-added-by-industry statistics program. It currently includes annual releases of the detailed supply and use tables, with a three-year lag, and monthly releases of Canada-level real-value-added-by-industry, with a two-month lag. The latter estimates are based on a much more limited amount of monthly information, but are benchmarked to the annual supply and use tables when they eventually become available.
Rating the quality of the linked time series
Below I rate the quality of the linked time series. I cannot rate the quality of the series obtained from Statistics Canada that are being linked, although it can be said that the series from 1997 forward are generally of highest quality and the other series are of lesser quality going backward in time. What is rated here is the quality of the linkages, not the series being linked.
Comparing the quality of one linked industry time series with that of another, some are relatively good, meaning the data are fairly consistent from one of the four distinct periods to the next, while others are not as good because the industry definitions do not align as well.2 Generally speaking the higher-level aggregates are the most reliable. Many of the lower-level industry results are also of good quality, but some are less so either because of differences in the industrial classification over time or because of the difficulty of obtaining good weights to aggregate series in the few cases where that is necessary.
The list below presents a judgemental assessment of the quality for each industry, with A representing the best quality, C the lowest and B somewhere in-between. In general, the more problematic linked time series tend to be from the services sector, the products of which have changed greatly over the 80-year linkage period and which was not as comprehensively measured as the goods sector by Statistics Canada in the earlier periods.
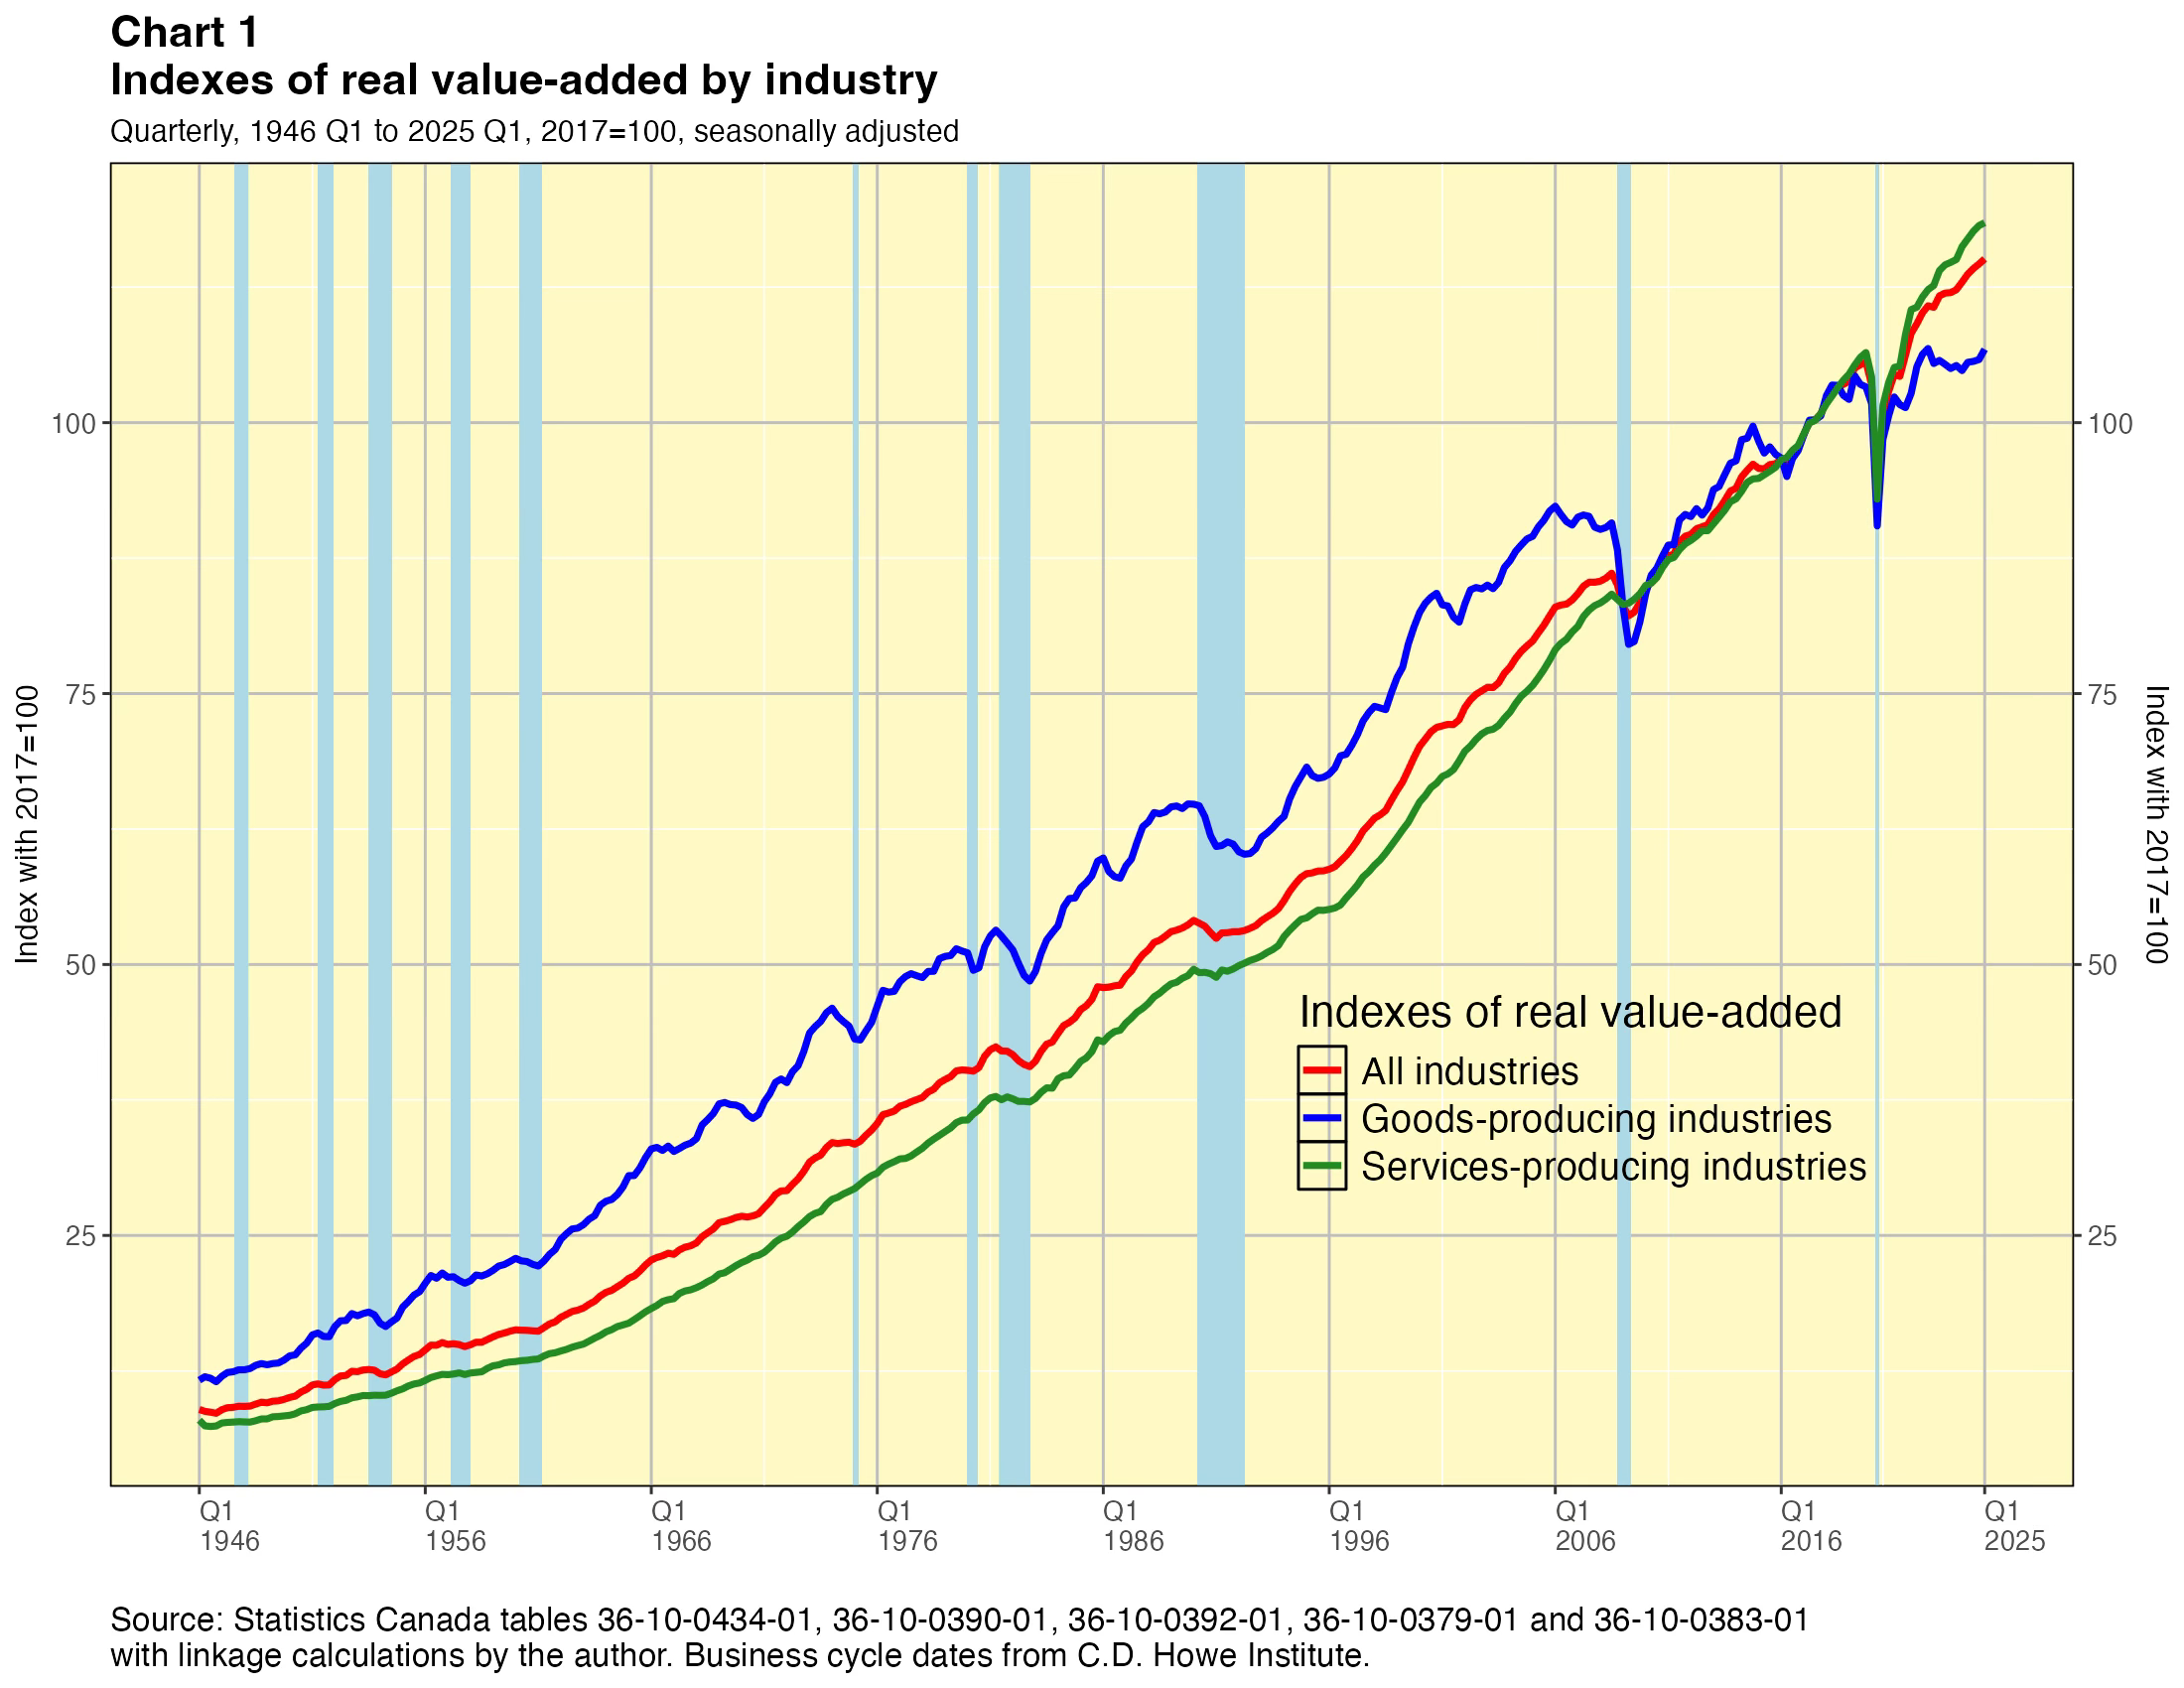
A - All industries
A - Goods-producing industries
A - Services-producing industries
A - Industrial production
A - Business sector industries
B - Non-business sector industries
A - Agriculture, forestry, fishing and hunting
A - Mining, quarrying, and oil and gas extraction
B - Metal mining
B - Non-metal mining
A - Utilities
B - Natural gas distribution
A - Electric power generation, transmission and distribution
A - Construction
A - Manufacturing
A - Non-durable manufacturing industries
B - Food and beverages
A - Tobacco products manufacturing
A - Textile products mills
A - Paper manufacturing
A - Printing and publishing
A - Petroleum and coal products manufacturing
A - Chemical manufacturing
A - Rubber products manufacturing
A - Non-metallic mineral products manufacturing
A - Durable manufacturing industries
A - Electrical products manufacturing
A - Transportation equipment manufacturing
A - Wholesale trade
A - Retail trade
B - Transportation
A - Warehousing and storage
C - Telecommunications
B - Finance, insurance and real estate
A - Educational services
A - Health care and social assistance
C - Arts, entertainment and recreation
A - Accommodation and food services
A - Public administration and defence
Looking at the results
The results are shown graphically in Annex 2. They tell some interesting stories about the evolution of Canada’s industrial structure since the end of the second world war. As noted earlier, the numbers can also be downloaded in spreadsheets.
Conclusions
The linked time series for real value-added by industry presented here are available for eight-decade-long studies of economic growth in Canada. I believe they are valuable for this purpose, though there are several caveats, as is usually the case when a long time series is created by linkage. To understand these warnings better the reader is referred to the methodology notes in Annex 1.
Annex 1
How the linked time series were derived
As mentioned, the linked series were derived using data from five different Statistics Canada online tables. Each contained indexes for real value-added by industry. There are three linkages in each case, done across four time periods: 1946-1961, 1961-1981, 1981-1997 and 1997-date.
The oldest table, 36-10-0383-01, provides quarterly statistics for 77 industry categories between 1946 Q1 and 1971 Q4, although for 27 of these categories data are available only from 1961 Q1 forward. Some 50 of the categories are for lowest-level industries while the others are for higher-level aggregates. The more recent tables provide more detailed industrial breakouts.
Conceptual changes
The international System of National Accounts (SNA) was first established in 1953. It was revised in 1968, 1993, 2008 and most recently in 2025. This is the standard that sets the definition of GDP. When the standard is updated there can be changes to what is in scope for GDP, such as the capitalization of research and development expenditures and weapons of war in 2008 which changed the status of those products from intermediate to final expenditure. The international SNA and its evolution since the second world war is explained here.
To my knowledge, Statistics Canada has not revised any of the value-added-by-industry statistics from the pre-1997 era to be consistent with the new GDP scope adopted for the post-1997 estimates. This means the linked time series estimates do not have a consistent definition across the linkage boundaries. In my judgement the SNA changes are relatively minor so this is not a big problem for the aggregates, but it might be more significant in some specific industries.
Classification changes
The industrial classification system was quite rudimentary in the 1940s and 1950s and lacked much detail. Over the subsequent years it expanded and changed substantially. Continual changes to the industrial structure are a normal aspect of any dynamic free-market economy and the industry classification system must always try to keep up.
Today’s Canadian economy is far different from the one that emerged after the second world war so it is no surprise there are a great many changes to the industry classification system over that 80-year period. In some cases Statistics Canada has adjusted the industry estimates for some prior years to account for these changes, but there are no classification adjustments improving the comparability of the estimates among the five basic tables from which the linked time series are created. This means the movements observed in some of the linked series may partially reflect classification changes rather than real economic changes. To the degree this is a problem it will occur when analyses cross the linkage boundaries, which are 1961, 1981 and 1997. On the bright side though, analyses confined within any one of the four distinct periods should not be much affected.
Constant prices
All of the linked time series are indexes of value-added at constant prices. The more recent series, from 1997 to date, are annually chain-linked constant prices. Those for earlier periods are at the constant prices of a particular year: 1997 prices for 1981-1996, 1986 prices for 1961-1980 and 1961 prices for 1946-1960.3
Aggregation weights
Aggregation weights (that is, value-added by industry at current prices) are available for the post-1961 time series4 but not for the 1946 to 1960 period. Accordingly, where aggregating was necessary for the immediate postwar period, it was accomplished using the weights from 1961. However, in most cases no aggregation was necessary on my part. For example, real value-added for the manufacturing industry is the linked time series for total manufacturing for each of the four time periods. It is not created by aggregating the linked time series for the component manufacturing industries.
Seasonal adjustment
All of the time series that were linked together were retrieved in seasonally adjusted form.
Annex 2
Charts
The following charts can be individually opened, saved and magnified using the tools of your operating system. If you right-click on one of the charts, that should open a menu allowing you to do so.


Unfortunately, for several of the services industries, adequate data are unavailable for the 1946-1960 period.
The reader will observe in the charts that sometimes an aggregate index appears to be inconsistent with its components. For example, the components might all be growing more rapidly than the corresponding aggregate over some extended period of time. This is not an error. Rather, it is a mathematical property of chain indexes. Mathematically speaking, there is no reason why components of a chained aggregate must change in a manner consistent with the chained aggregate itself when the comparison time period crosses a link in the chain.
If a constant-price time series covering periods 1, 2 and 3 is a chained index, that means the percentage changes from period 1 to period 2 are calculated at constant prices that are the average of the prices in periods 1 and 2 while percentage changes from period 2 to period 3 are calculated at constant prices that are the average of the prices in periods 2 and 3. If the constant-price time series covering periods 1, 2 and 3 is not a chained index, that means the percentage changes from period 1 to period 2 and also from period 2 to period 3 are both calculated at constant prices of the same designated period. That designated period might be some arbitrarily chosen year, for example, or the average of several years.
Statistics Canada tables 36-10-0394-01 and 36-10-0395-01 are useful in this regard.