
Measuring improvements in Canadian standards of living

How much has the standard of living of Canadians improved over the last half century or so? And how much has it improved more recently, in just the last few years? There are many ways to try to answer these questions.
One frequent approach, which is also adopted here, is to pick a time series measure of “real income” and divide it by a time series measure of “Canadians”. Often gross domestic product, adjusted to remove the impact of inflation, is the income measure. An alternative is to choose after-tax personal or household income, also adjusted for inflation. As the measure of “Canadians”, the easiest approach is to use the country’s total population. An alternative is to use the number of Canadian households. The selected “real income” and “Canadians” measures are then combined to estimate the standard of living of the “typical” Canadian. Most would agree the best way to do this is to obtain micro data and find the median of the ratio. However, for some real income measures, most notably GDP, micro data are unavailable so the median cannot be calculated and a simple average must be used instead.
The specific methods just mentioned have their pluses and minuses, which I will not discuss here. Rather, I will look at the answers to the questions posed in the first paragraph that emerge when the chosen measure of income is “total real family income” and the measure of Canadians is the number of families. Annual statistics for these concepts are available from Statistics Canada in its table 11-10-0191-01 for the period 1976 to 2023.12
Canadian Income Survey
The family income estimates just cited come from the Canadian Income Survey (CIS). Conducted once a year, its results are combined with comprehensive personal income tax data and Labour Force Survey data to produce the published estimates. Table 1 provides a summary of the aggregate results for 2023 from the survey.
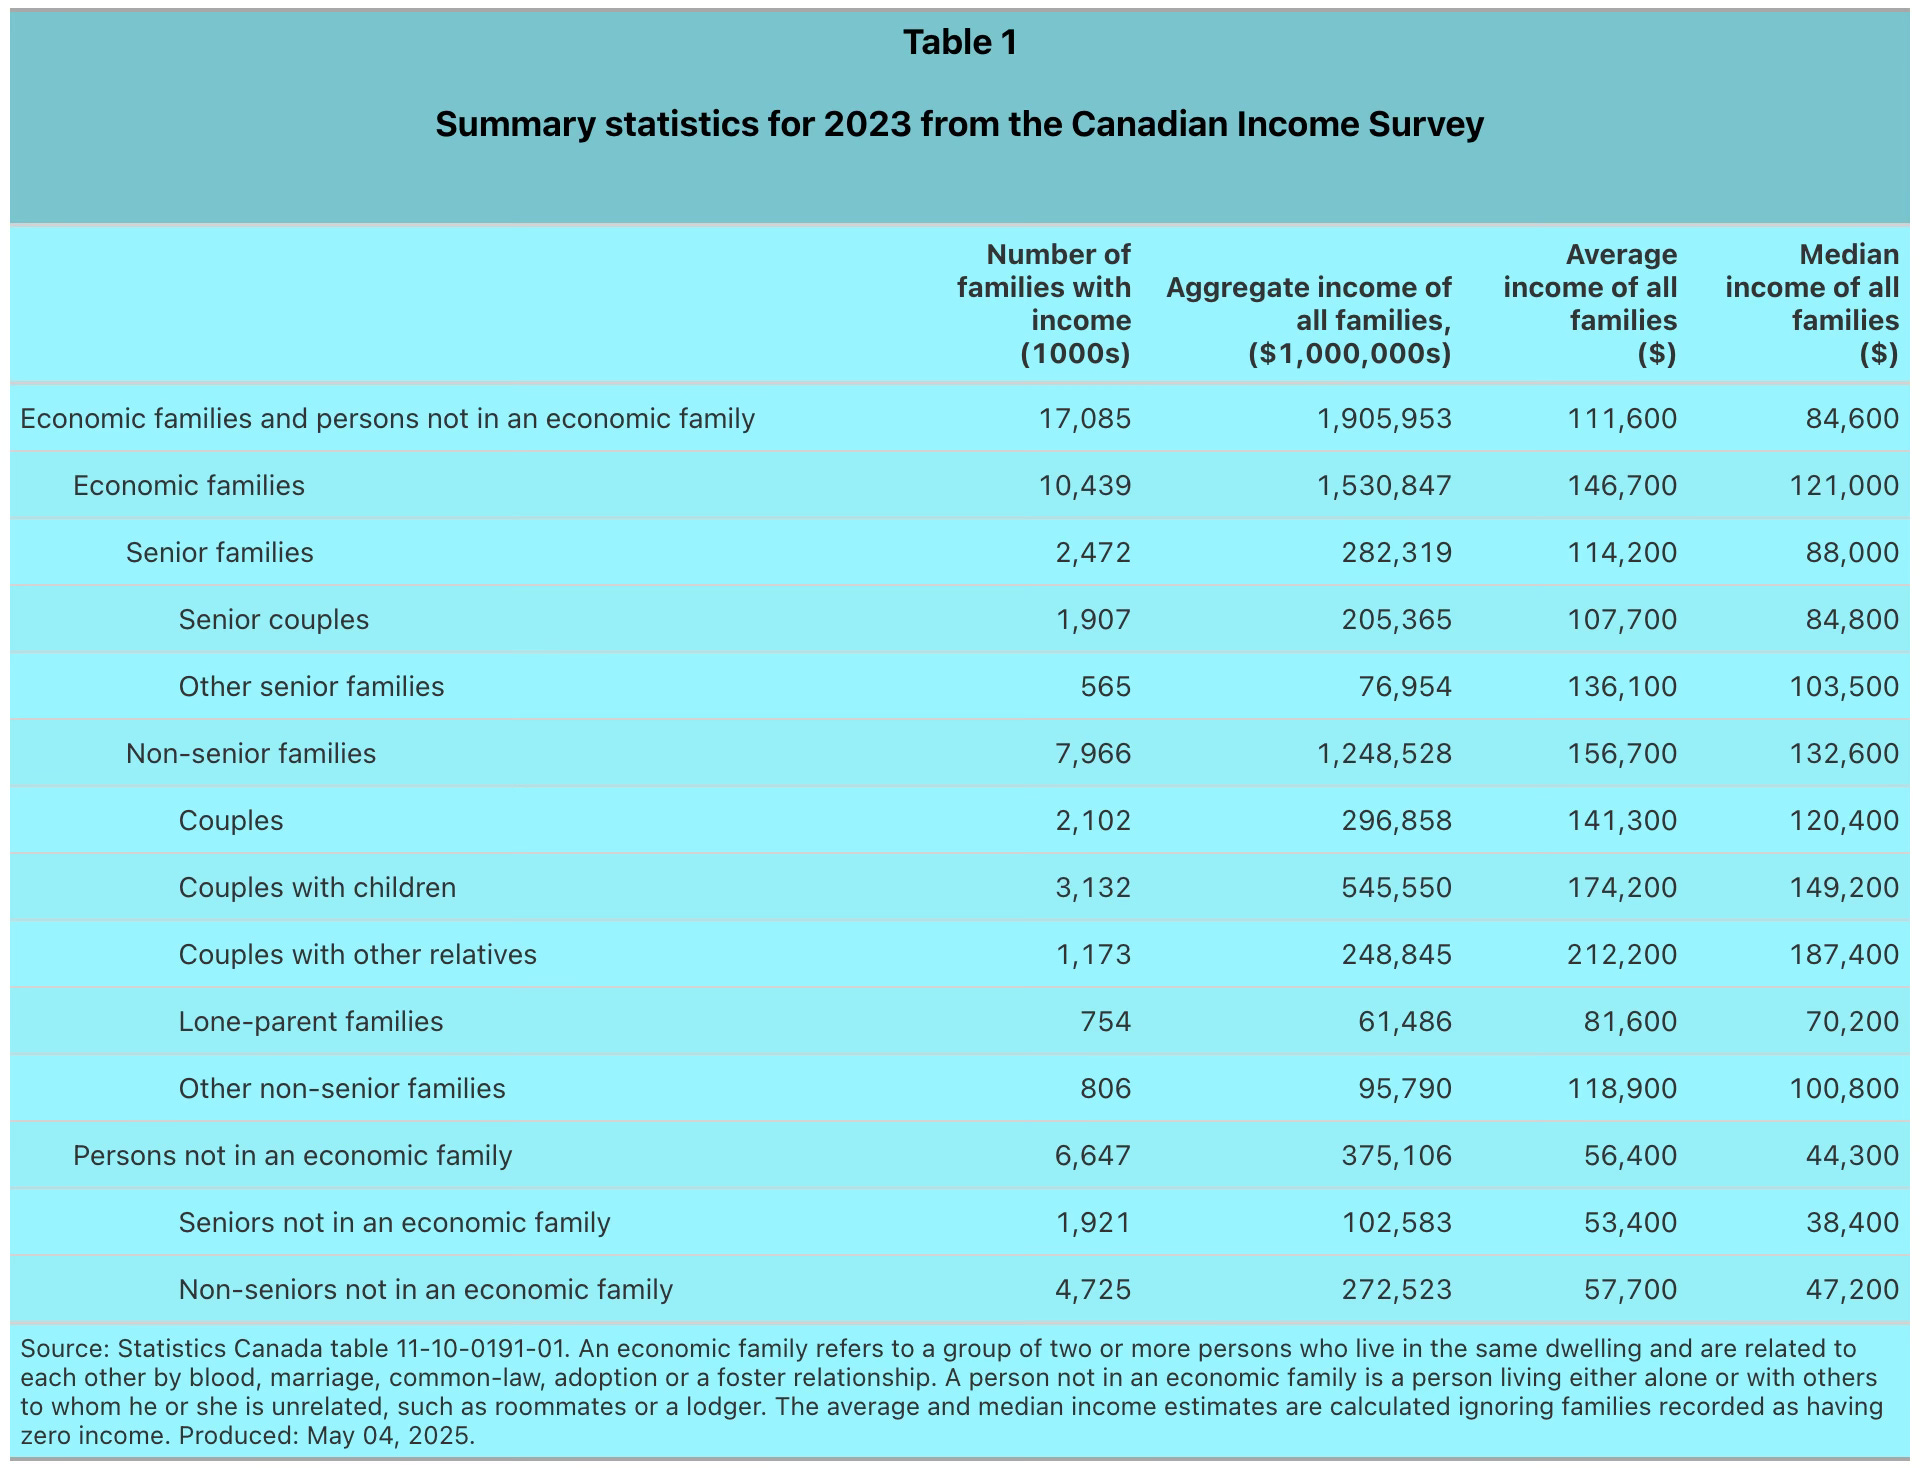
The survey estimates indicate there were 17,085,000 families in Canada, their aggregate income was $1,905,953 million and the median income of these families was $84,600 in 2023. The average income, $111,600, was of course considerably higher than the median because of the impact of a relatively small number of very high income families.
Table 1 also shows a breakdown of the aggregate statistics by nine distinct types of family. The range of family incomes is quite wide, extending from just $38,400 for ‘seniors not in an economic family’ to $187,400 for ‘couples with other relatives’. The number of families in each group also varies considerably. There are only 565,000 ‘other senior families’ while there are 4,725,000 ‘non-seniors not in an economic family’.
Changing composition of total Canadian families by type
The types of families shown in Table 1 are quite diverse and their shares within the total number of families have been changing substantially through time. Chart 1 shows these shares over the 48-year period from 1976 to 2023.
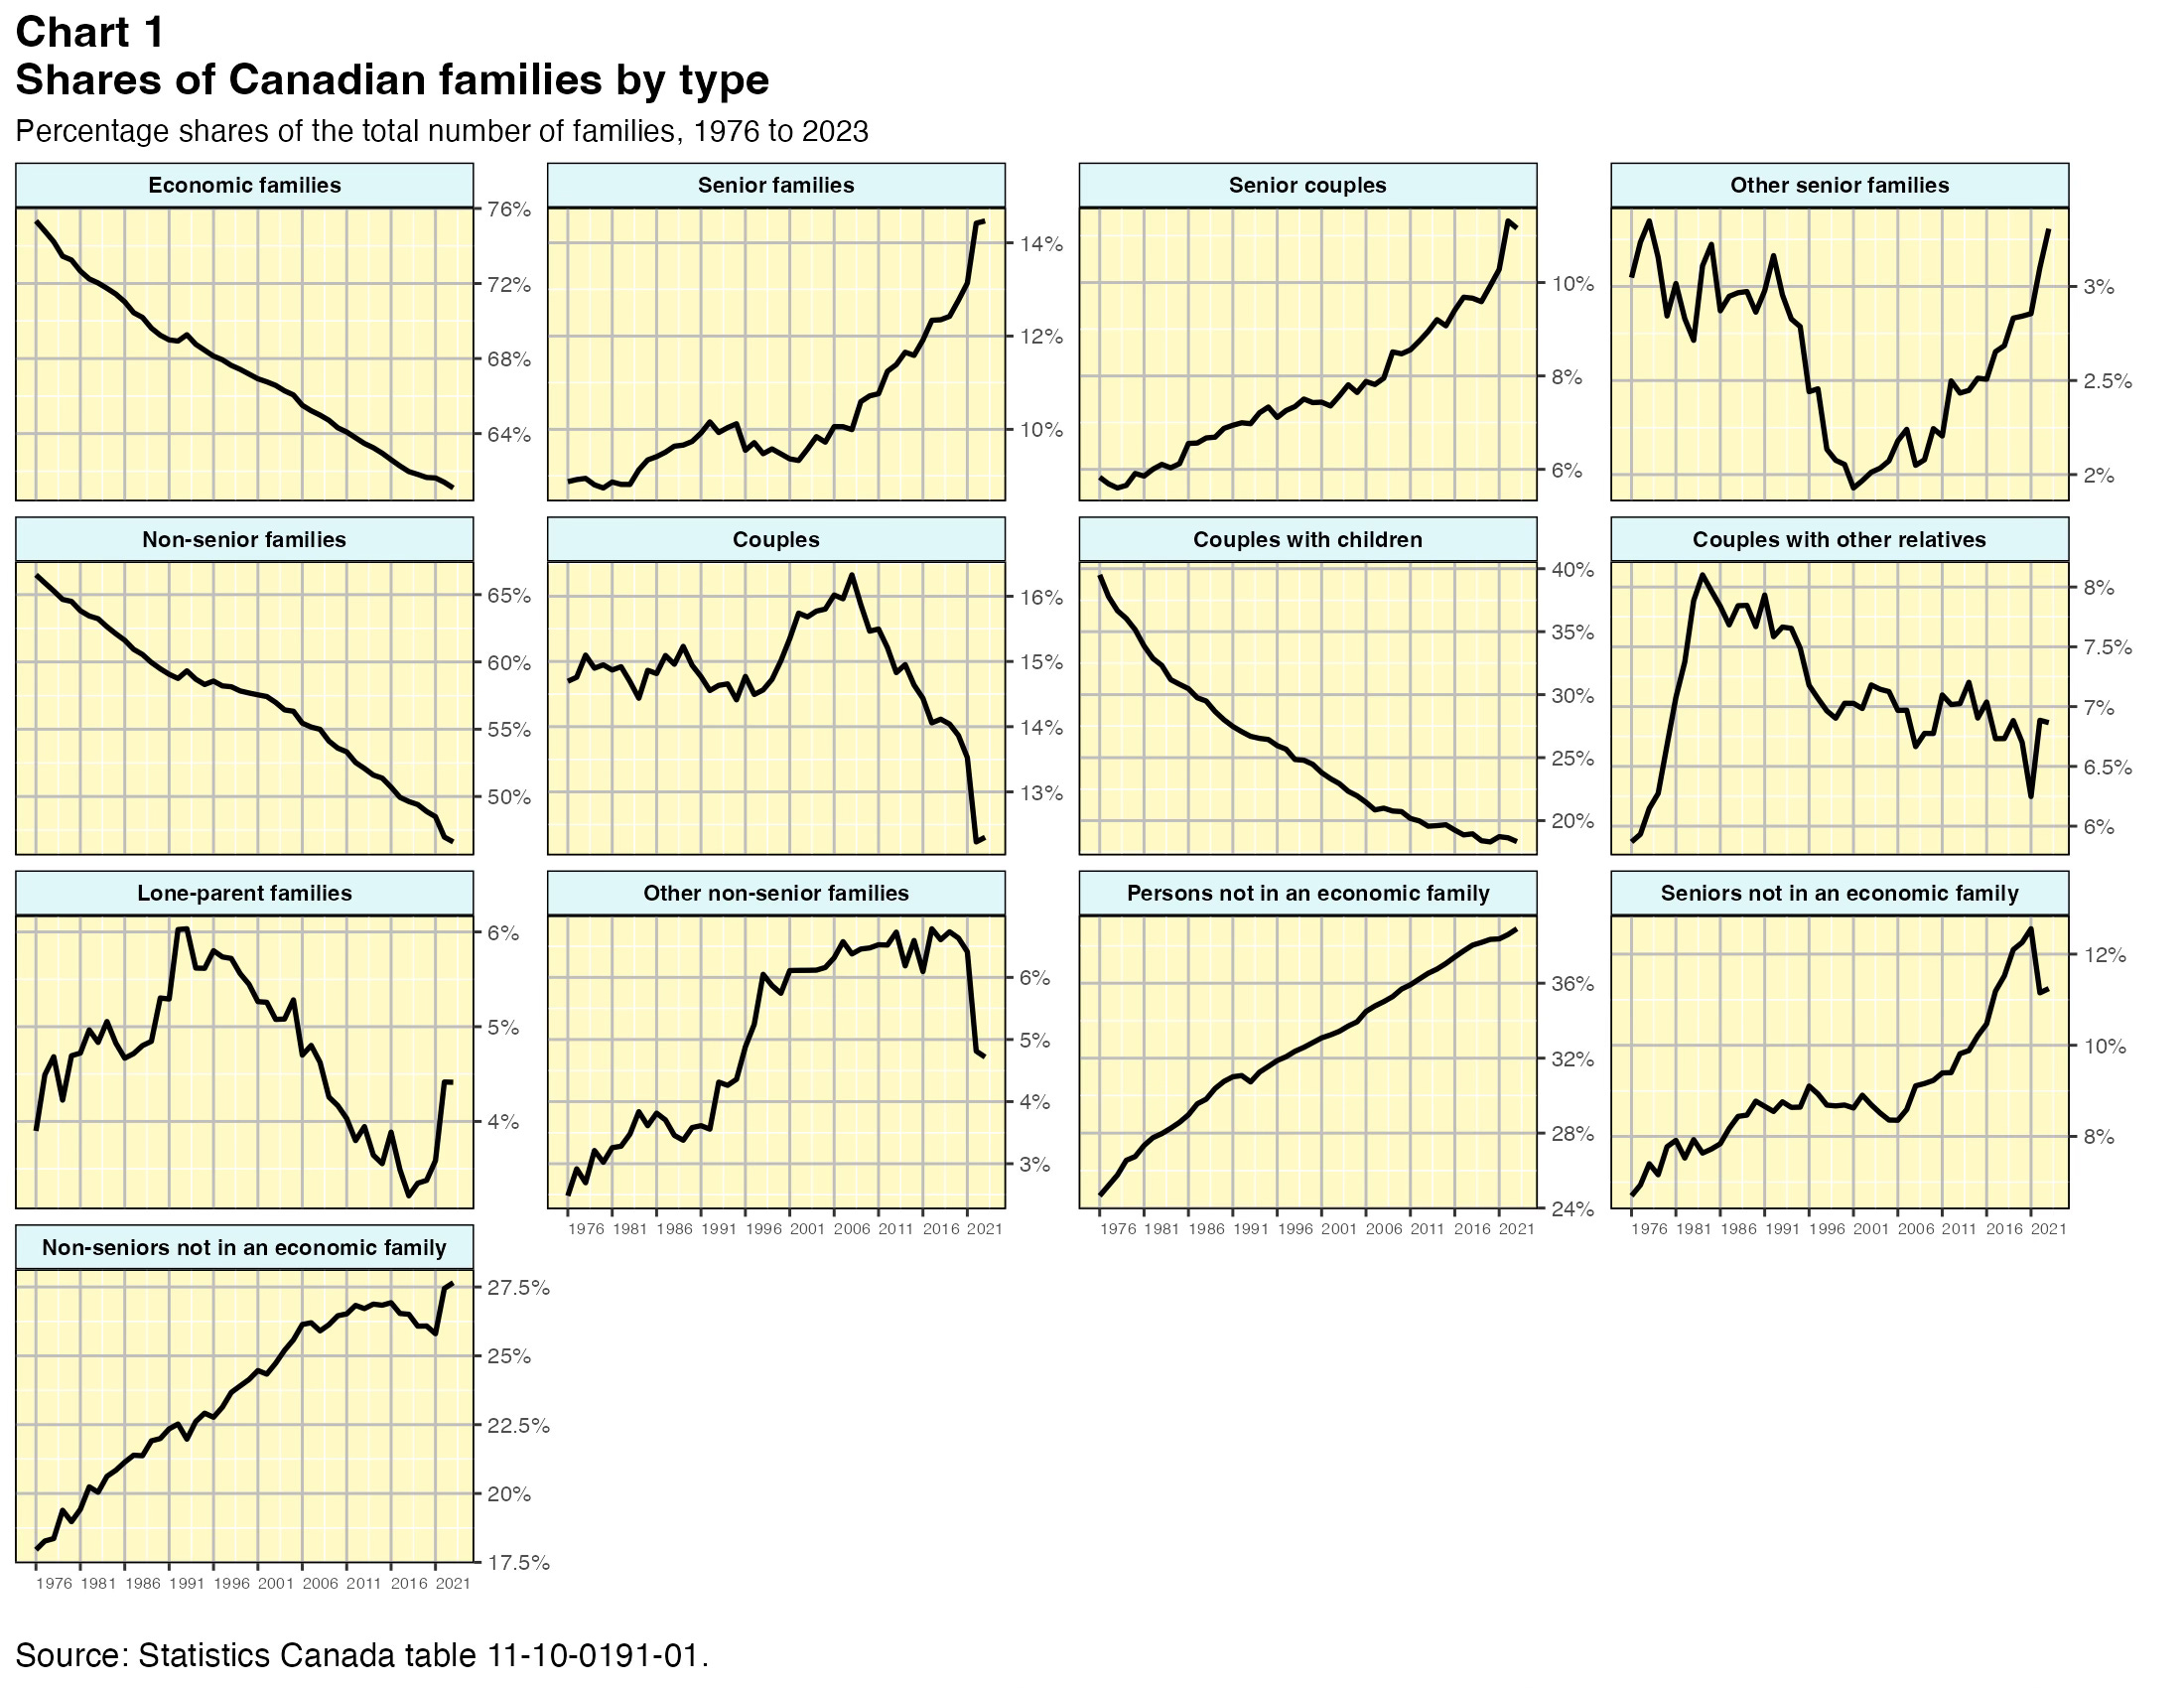
Overall there has been a steady downward trend in the share of ‘economic families’ — those with two or more persons who live in the same dwelling and are related to each other by blood, marriage, common-law, adoption or a foster relationship — and a corresponding upward trend in the share of ‘persons not in an economic family’ — those living either alone or with others to whom he or she is unrelated, such as roommates or a lodger. The former category accounted for 75.3% of all families in 1976 but only 61.1% in 2023 while the latter category rose from 24.7% to 38.9%. This ongoing shift between the two broad family categories is partly due to the changing role of women in society, who have become better educated, earn higher salaries, are more independent than in the past and are generally having fewer children. The phenomenon is also related to a broad trend studied by Robert Putnam3 and others around the turn of the century that was referred to as a decline in the social capital4 of the United States and, by extension, Canada. The emergence of the Internet, social media, cellphones and related digital technologies has furthered this evolution.
Median real family income growth
The median real incomes by family type that are shown in Table 1 have changed substantially over the last half century. Table 2 shows compound average growth rates (CAGRs) for each of the family types over various time periods.
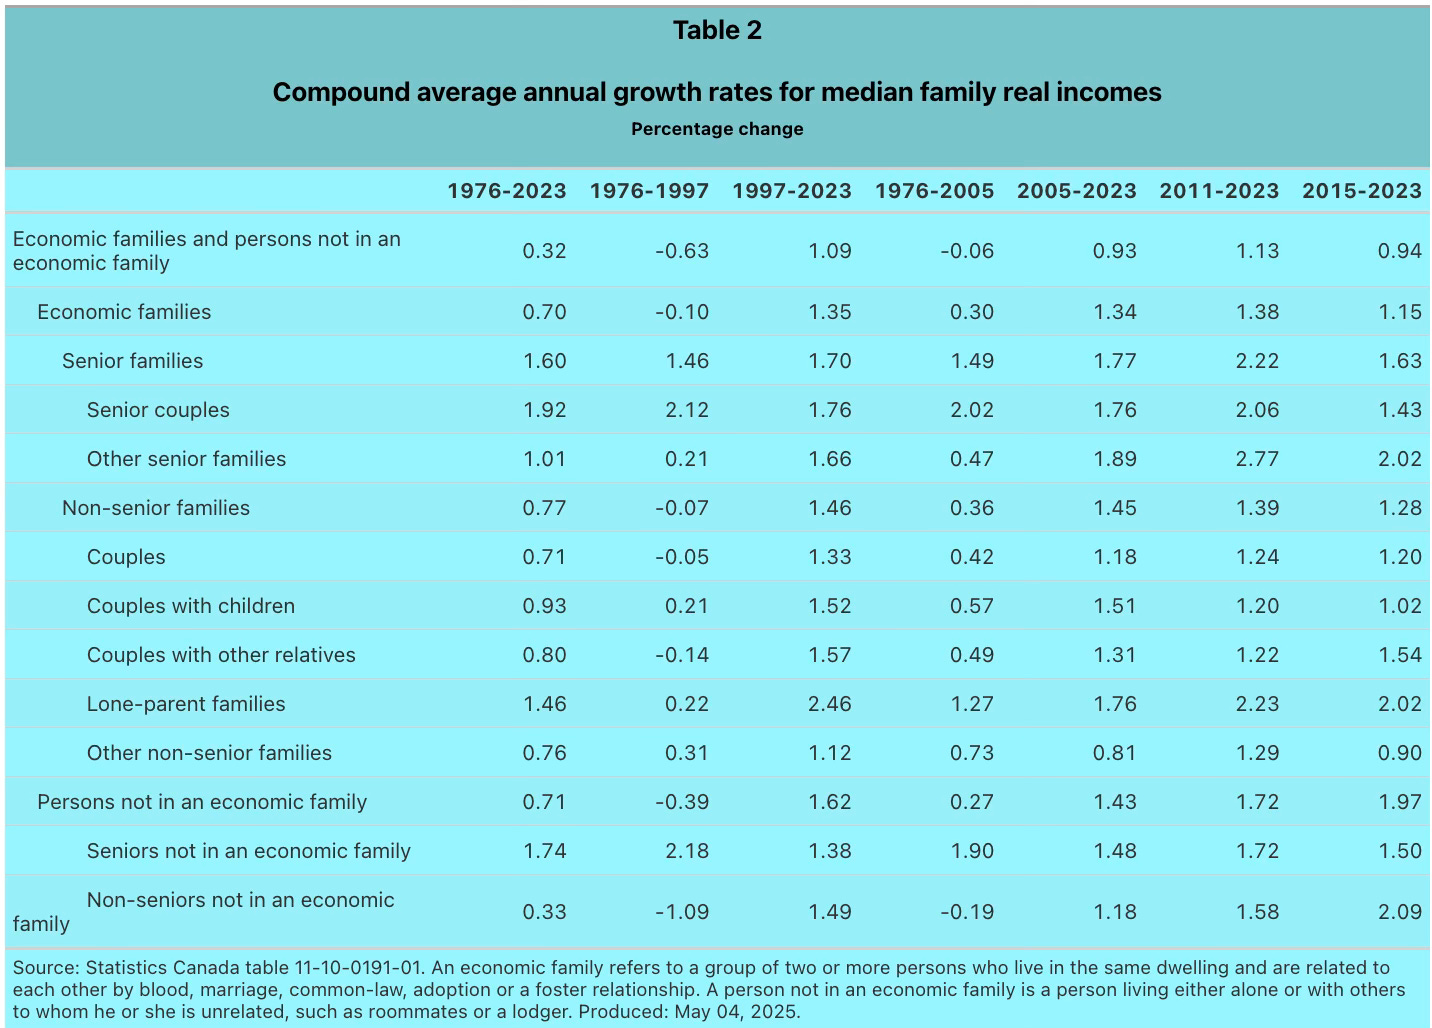
Median real income of all families combined had a CAGR of just 0.3% over the full period. It decreased at a -0.6% average annual rate between 1976 and 1997 and rose at a 1.1% average rate from 1997 to 2023. The 0.3% overall average rate of advance over the full period was made up of 0.7% rates of increase for both ‘economic families’ and ‘persons not in an economic family’. As can be seen in Table 2, the real median income growth rates were higher, in some cases much higher, for sub-groups within these two major groups.
The implication here is that the overall average growth rate, for the median real income of all families combined, is a misleading indicator. It is greatly affected by the shifting composition by type of family. This can be seen in a simple example. Suppose there are only two families, both with incomes of $250,000 and both containing three earners with incomes of $100,000, $100,000 and $50,000. Median income in this scenario is $250,000. Now suppose that in a subsequent period the incomes of the six earners have not changed, but one of the two persons earning $50,000 moves away from his family and is living separately. There are now three families instead of two and the median income of the three families is $200,000. The median income has decreased 20%, even though all of the six earners have experienced no change in income.
In other words, given the trend over the last half century away from ‘economic families’, which tend to have higher incomes in large part because there can be more than one earner within the family, and toward ‘persons not in an economic family’, which tend to have lower incomes because they can only have one earner by definition, the growth of the median real income of all families combined has been held back by compositional change.
A fixed-weight average of median real incomes
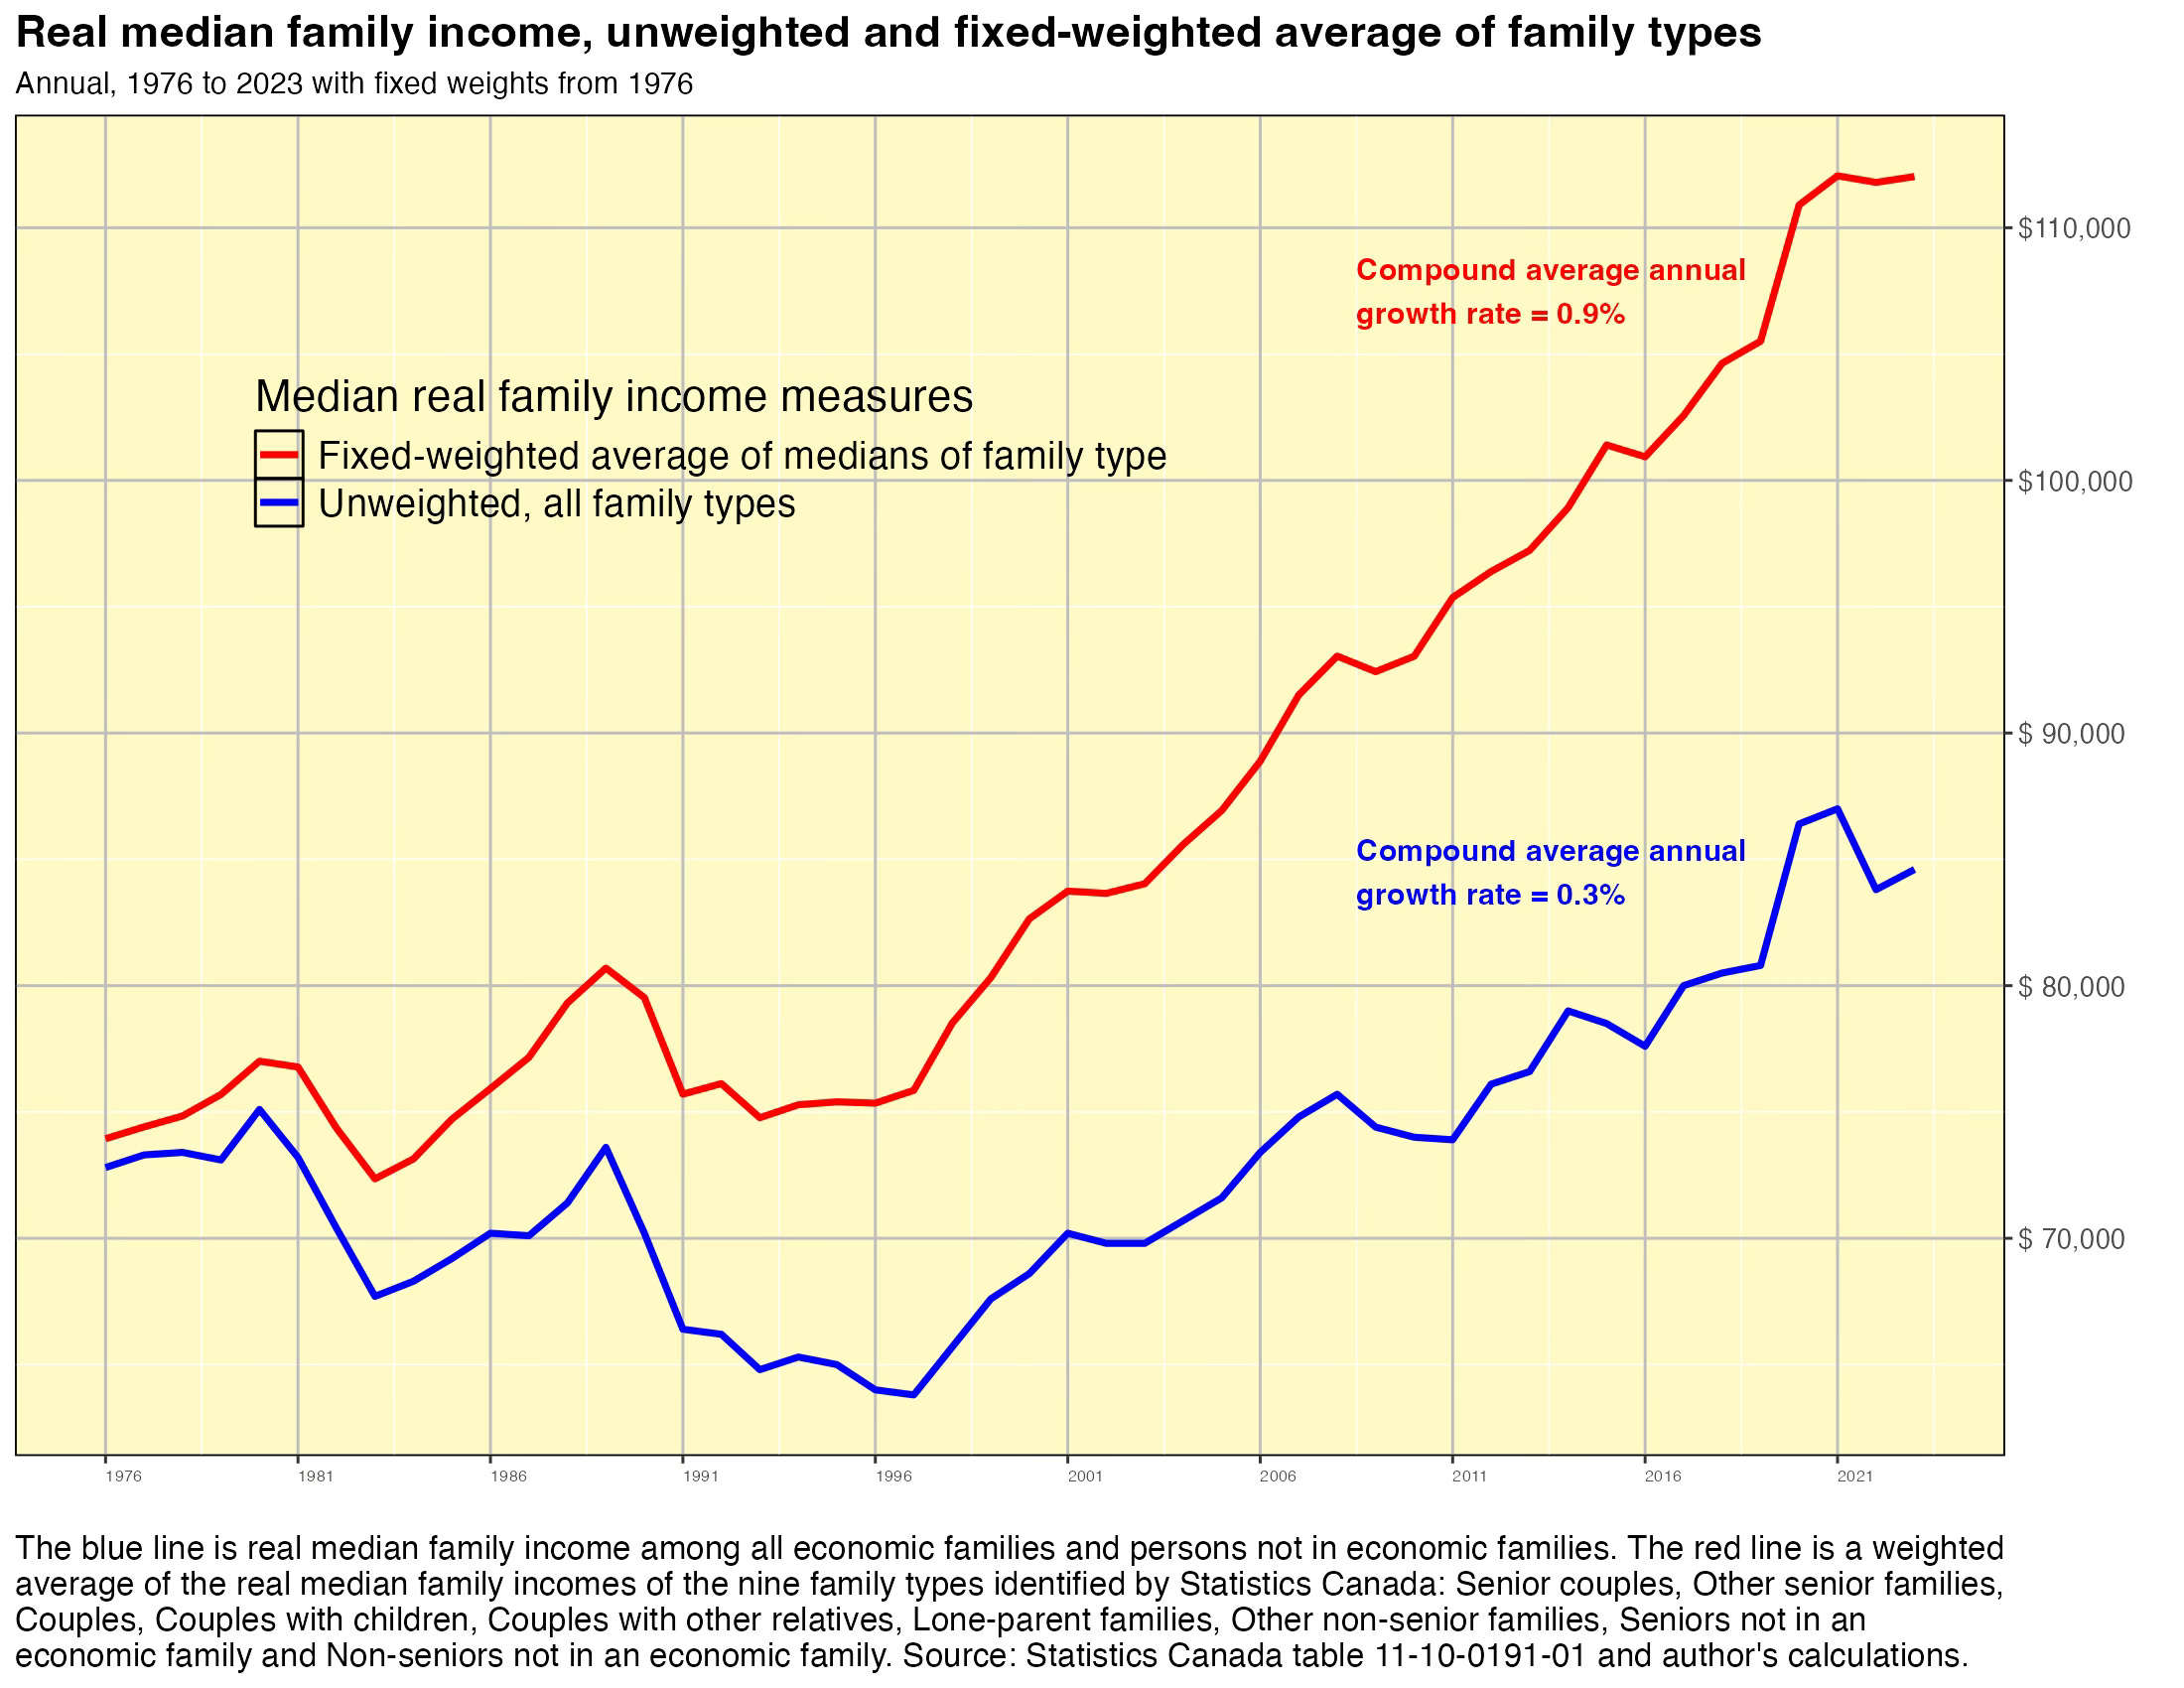
One way to adjust for this composition-related distortion is to calculate a fixed-weight average of the medians of the nine distinct family types. Chart 2 shows the result of doing so, using the 1976 shares of the different family types as fixed weights in an average of the nine median real incomes.
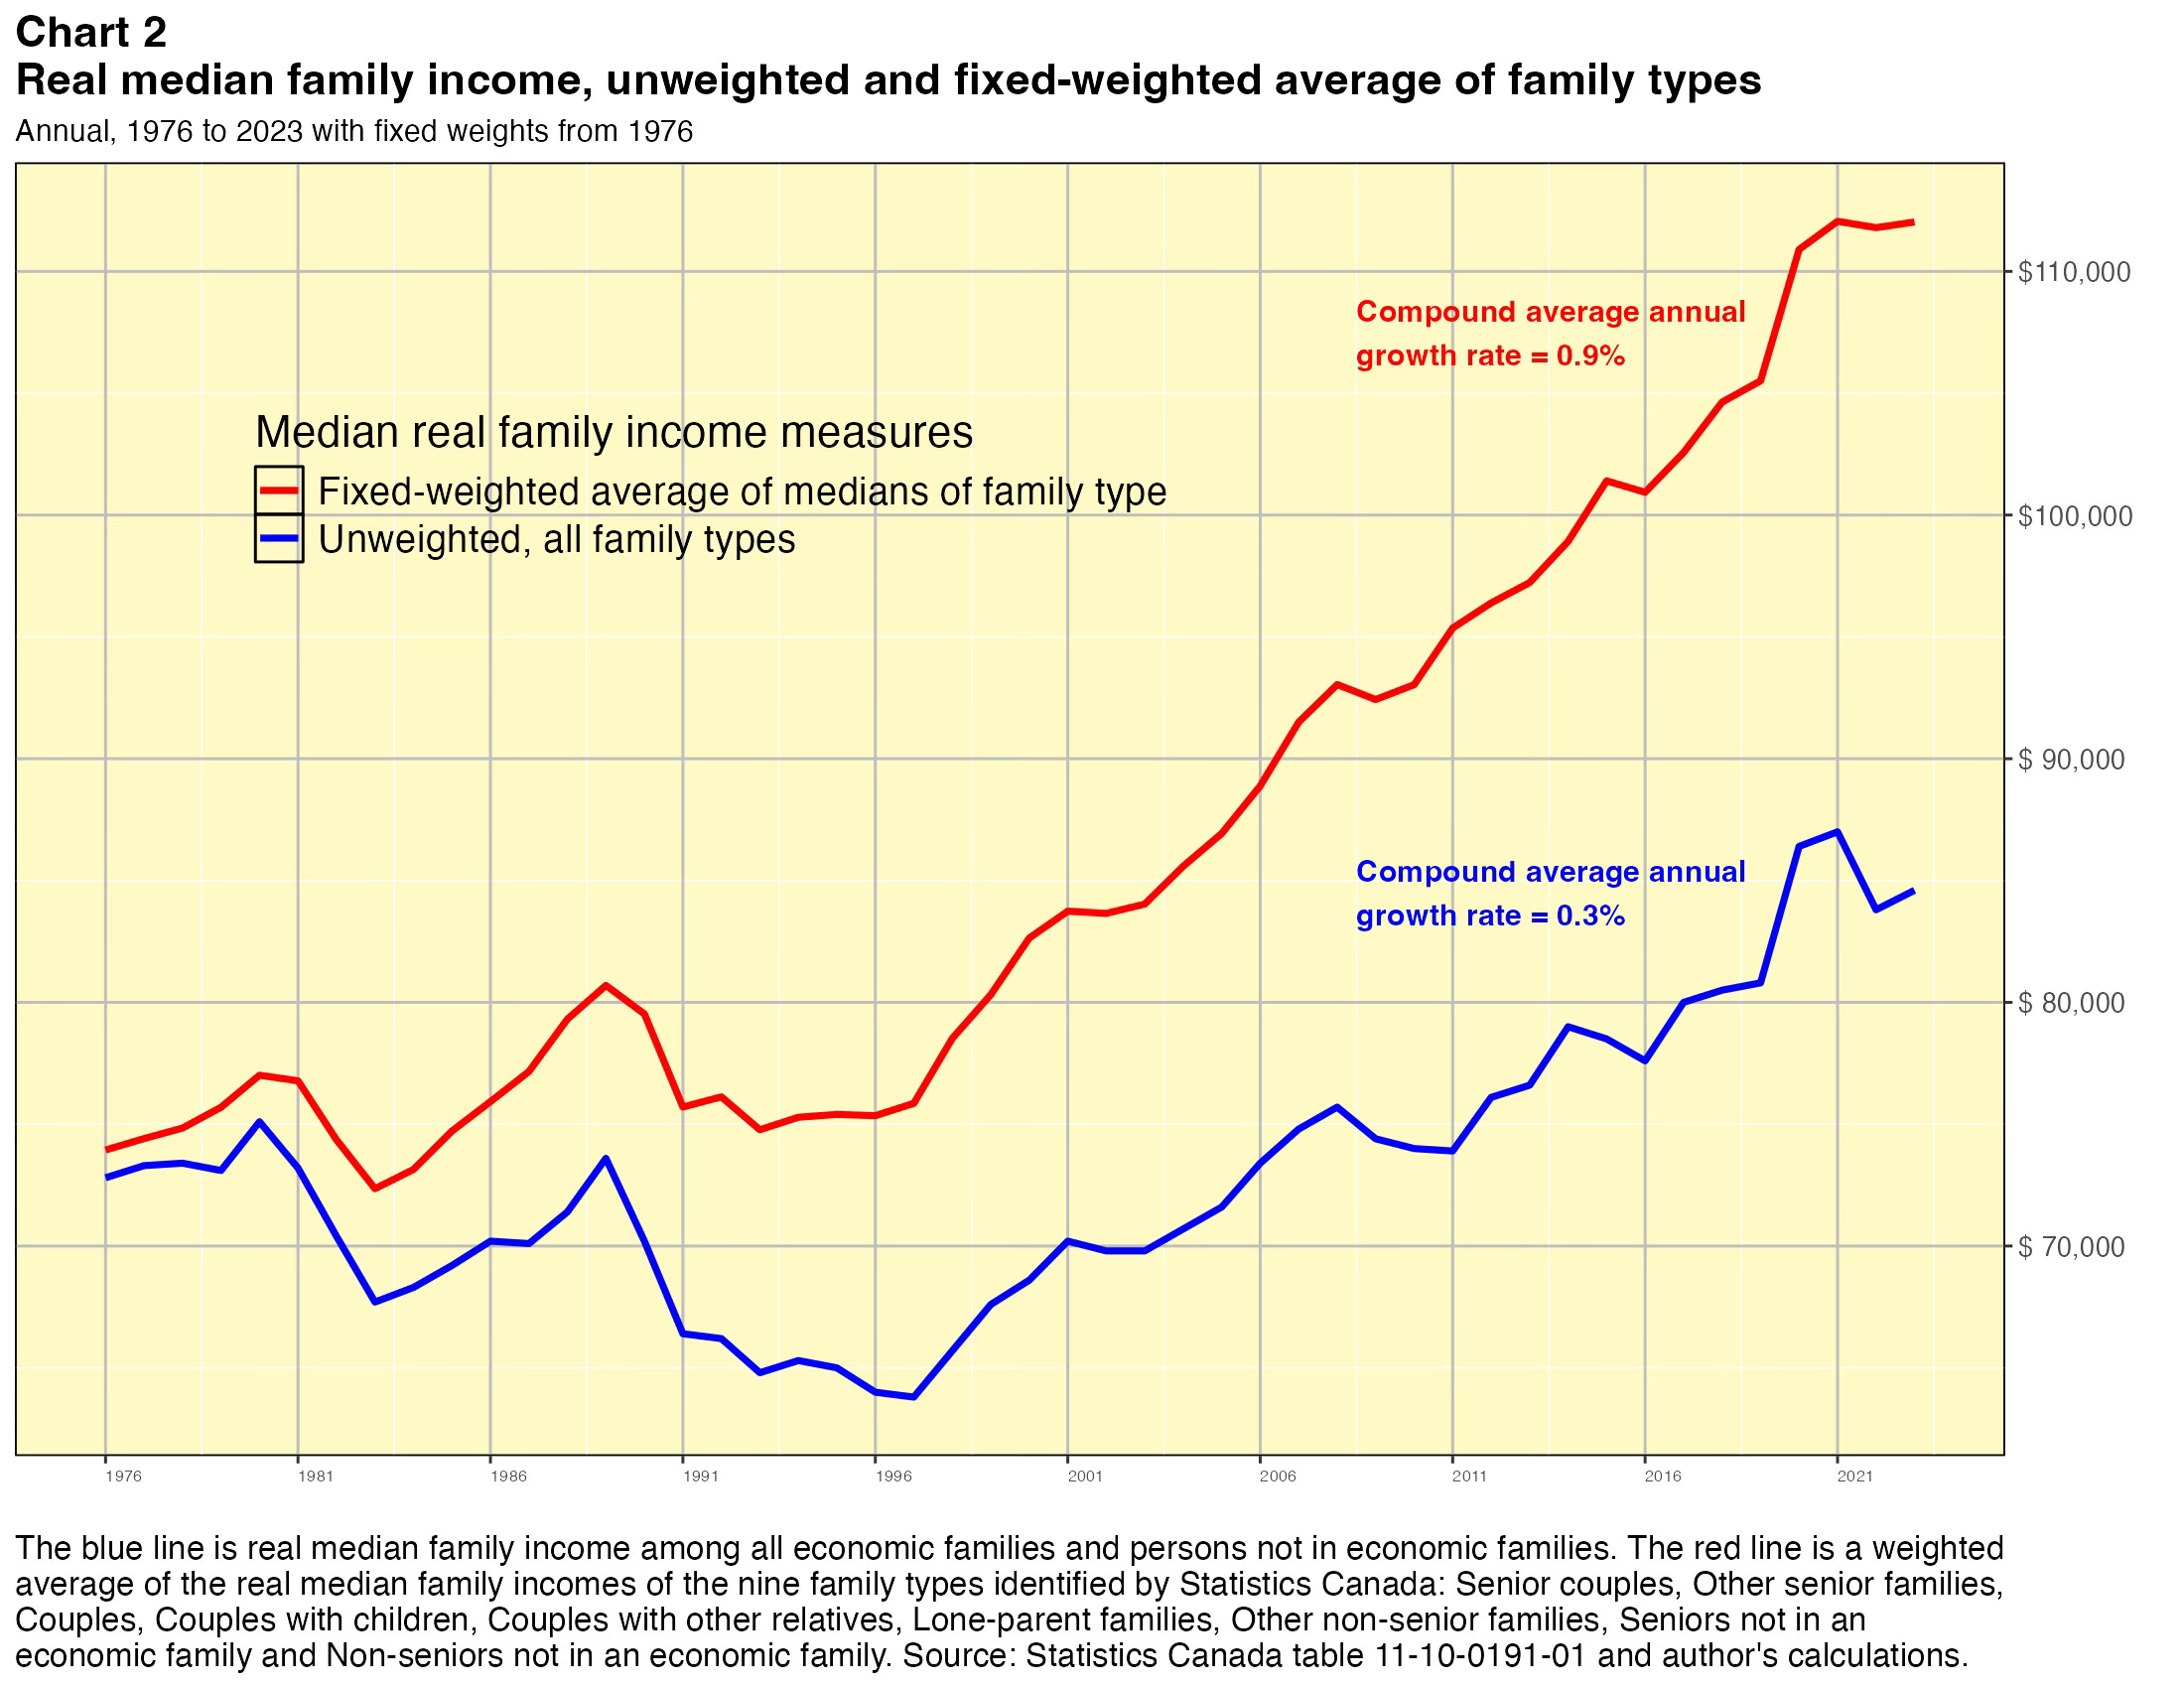
The fixed-weighted average of the median real incomes grew at a 0.9% compound annual average rate over the period to 2023, compared to just 0.3% for the median of all real family incomes with no weighting. This is a very big difference.
But even these rates of growth are relatively small insofar as they are held down by experience of the first two decades, 1976-1997, in which there were two major recessions, high unemployment, stagflation, tight monetary policy and continuing efforts to reduce fiscal deficits. Confining the calculations to the period beginning in 1997, the compound annual average annual growth rates are 1.5% for the weighted calculation and 1.1% for the unweighted one.
Finally, however, it should also be noted that the experience in the most recent three years, 2021-2023, has not been at all favourable. The unweighted median of real incomes declined at a -0.7% annual rate and the weighted one grew at just a 0.3% annual rate. These slowdowns in the post-COVID era are similar to those around 2001, 2008 and 2016, other periods when Canada’s economy weakened temporarily.
Conclusion
The measures of Canada’s standard of living discussed in this paper indicate families were much better off in 2023, in fact 52% better off after adjusting for shifts in the composition of the typical family, than they were in 1976. On this same basis, the median real income of families grew at a compound annual average rate of 0.9% over the full 48-year period and 1.5% over the more recent period beginning in 1997. These improvements in the living standard are quite substantial, although it should be noted the rates of increase have slowed or become negative during cyclical downturns and specifically this has been the case in the post-COVID era.
The estimates for total real family income in 2023 were released by Statistics Canada on May 1, 2025. The estimates for 2024 will be available about a year from now.
It can be argued that the most relevant income-earning and consuming unit for economic analysis purposes is the family. Incomes within the family are typically, though not always, treated as if they were combined as a single total amount. In addition and perhaps more importantly, most consumption is best regarded as common within the family rather than individual in nature. This is most obviously true for housing, appliances, food expenses, vacations, automobiles (though not always) and some other products.
Putnam is known for his book entitled Bowling Alone, published by Simon and Schuster in 2000.
Wikipedia defines the term this way: “Social capital is a concept used in sociology and economics to define networks of relationships which are productive towards advancing the goals of individuals and groups. It involves the effective functioning of social groups through interpersonal relationships, a shared sense of identity, a shared understanding, shared norms, shared values, trust, cooperation, and reciprocity. Some have described it as a form of capital that produces public goods for a common purpose.”