
Comparing Canada's two employment surveys

Introduction
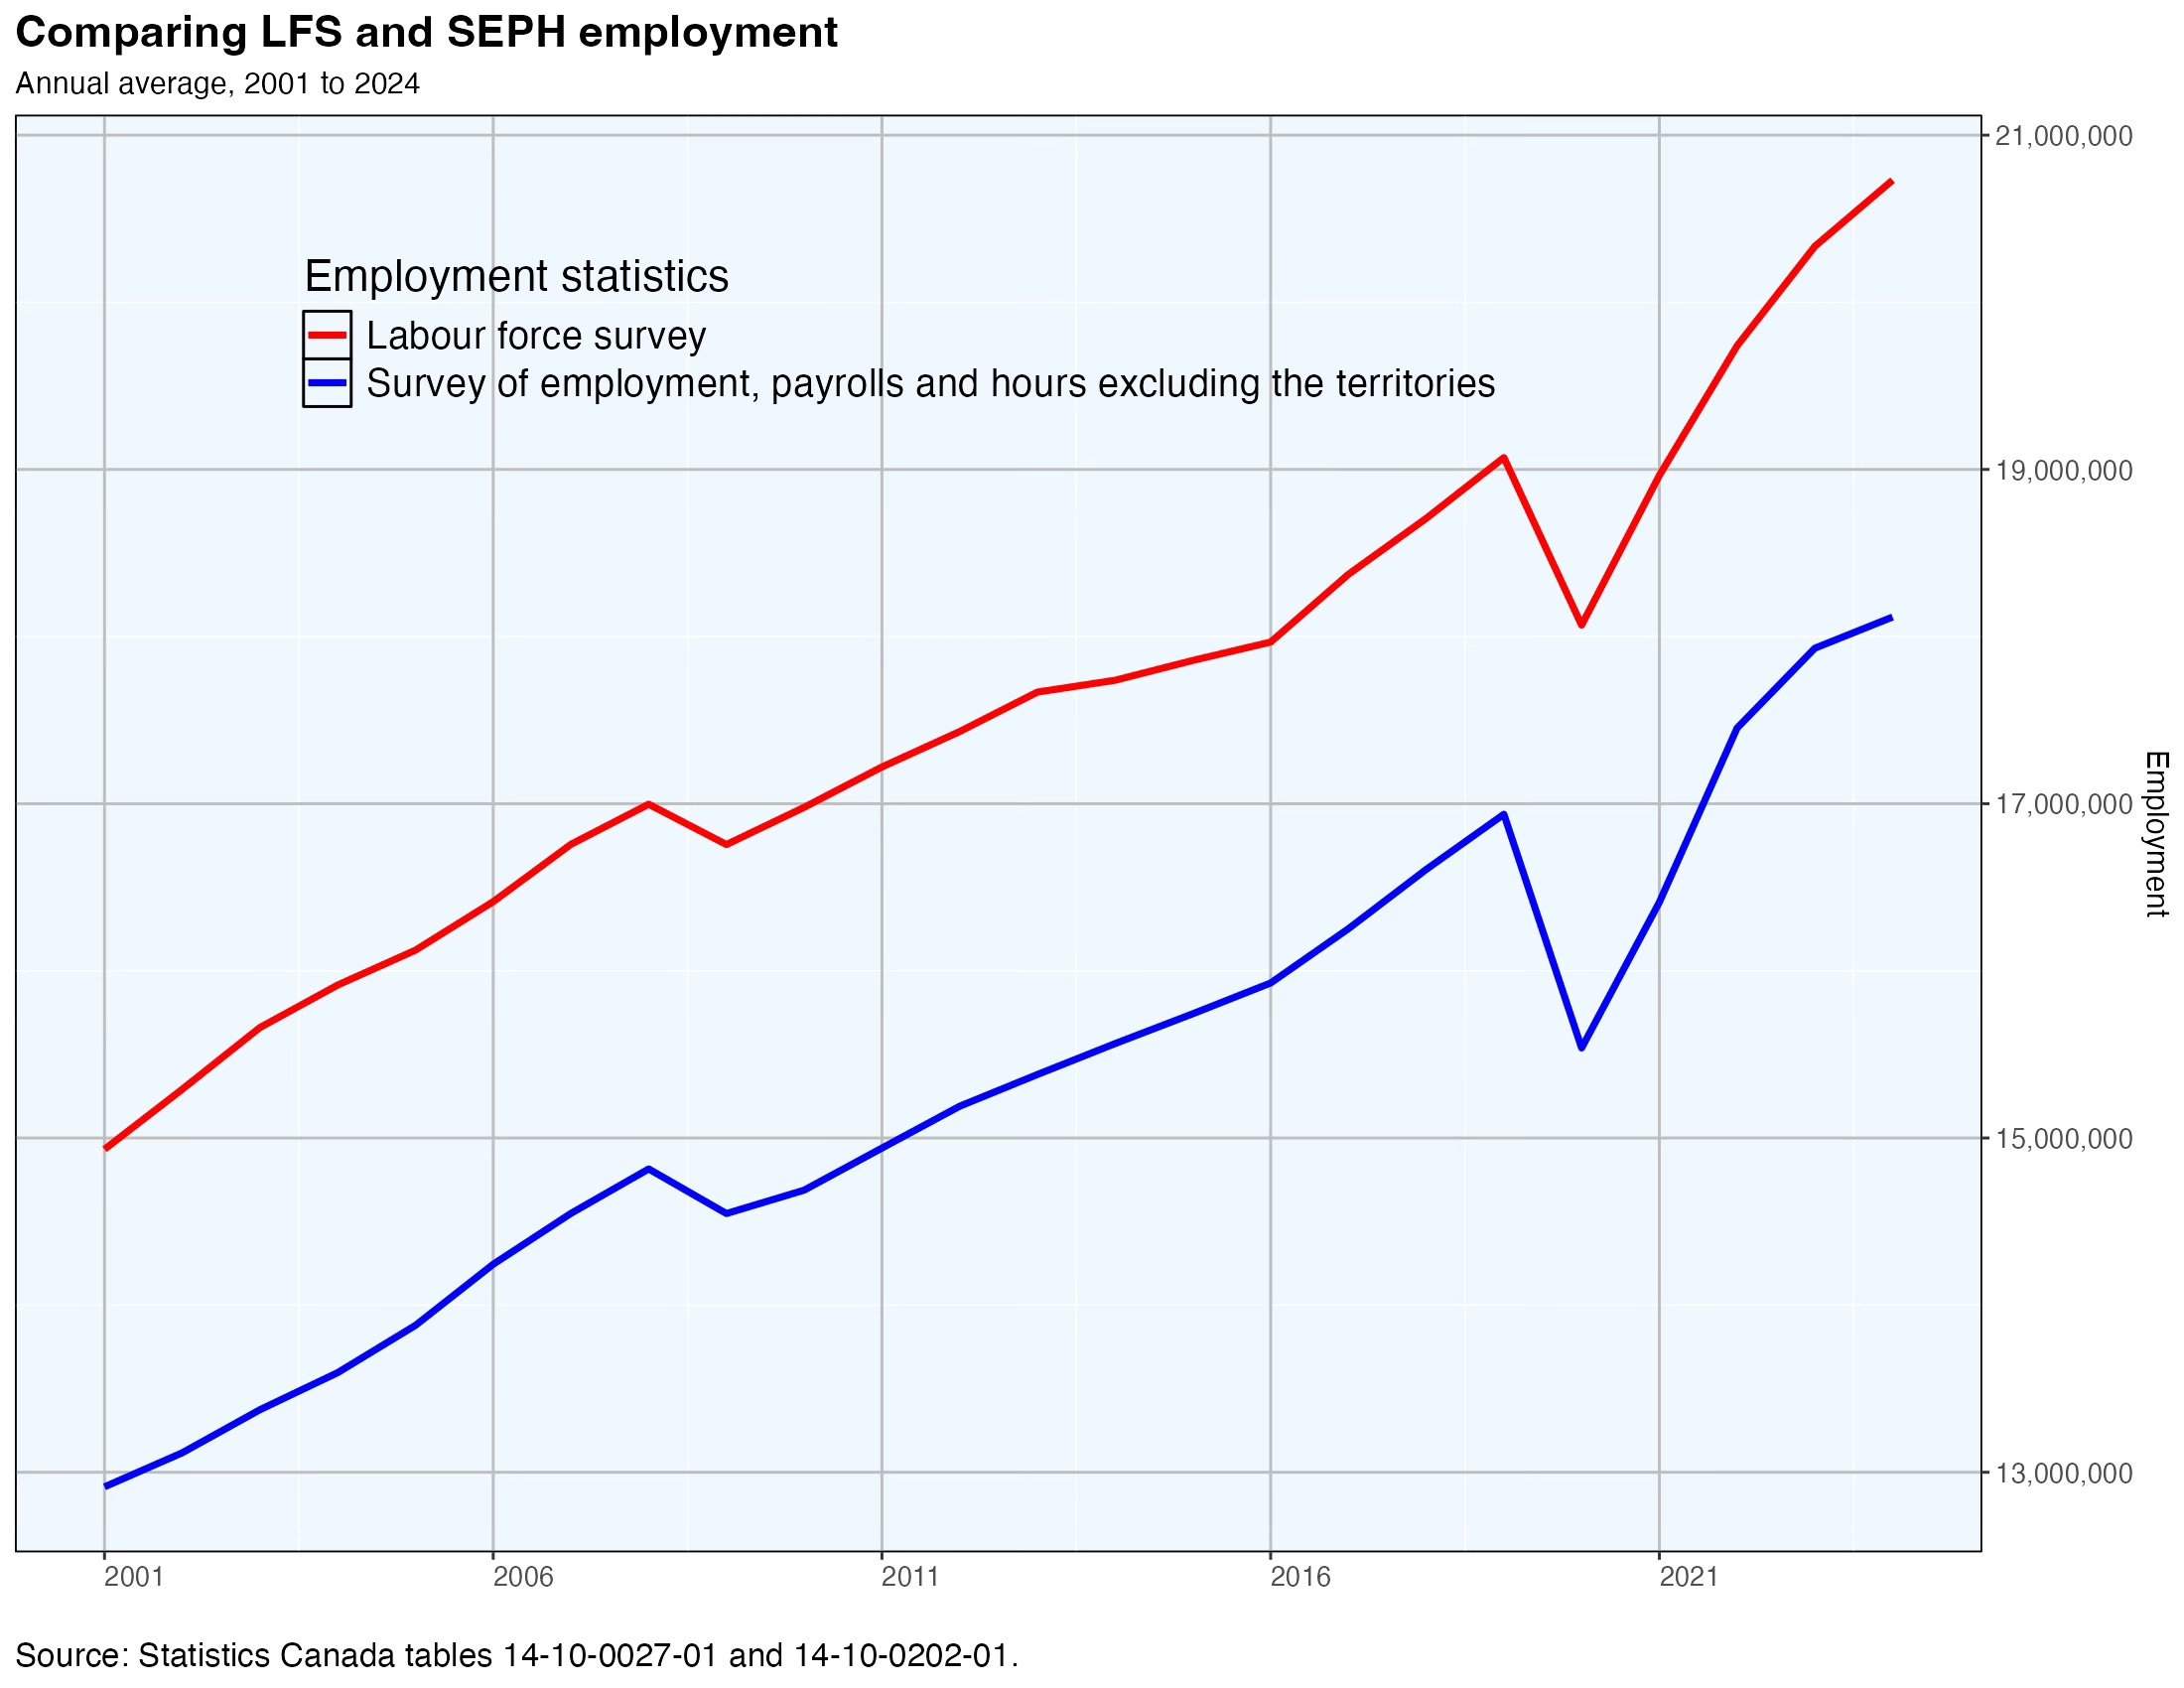
Canada has two principal surveys of employment. One is the Labour Force Survey (LFS)1, a sample survey of households which inquires about the employment status of individuals. The other is the Survey of Employment, Payrolls and Hours (SEPH)2, a survey of businesses that collects information about their payrolls, wages and salaries paid and hours worked. Unlike LFS, SEPH combines information from its questionnaire, sent to a relatively small sample of businesses, with comprehensive administrative data from payroll tax deduction forms filed with the Canada Revenue Agency.
The surveys provide two estimates of employment, one from the individual’s perspective and the other from businesses. While their respective employment trends are generally similar, their statistical estimates differ for a number of reasons. This paper outlines these reasons and shows their impact over the period 2001-2024.
The territories
SEPH national employment includes the three territories as well as the ten provinces. In the LFS national totals the territories are excluded. Territorial LFS results, which have quality issues due to the difficulty of collecting household data in remote areas, are published separately. To compare LFS and SEPH fairly, the estimates of employment in the territories are subtracted from SEPH.
Self-employed persons
Self-employed persons and unpaid family workers are in scope for LFS, but not for SEPH. They are subtracted from LFS for purposes of comparisons with SEPH.
Industries out of scope
SEPH excludes businesses that are primarily involved in agriculture, fishing and trapping, private household services and religious organizations whereas persons working in these industries are included in LFS. Employees in these industries are subtracted from LFS employment for purposes of comparisons with SEPH. However, employees in international and other extraterritorial public administration are included in SEPH but not in LFS and so are subtracted from SEPH.
Absent and unpaid employees
SEPH covers workers receiving pay and excludes employees who are absent without pay. LFS covers people who have jobs regardless of whether they are currently receiving pay. The absent and unpaid employees are subtracted from LFS for purposes of the comparison.
Multiple job holders
The LFS estimate of employment counts persons with jobs. One person with two or more jobs counts as just one employed person. SEPH counts jobs, not persons, so persons with two or more jobs are counted two or more times. For purposes of comparison, the LFS employment estimate includes the identified multiple job holders twice rather than just once (assuming most of them have two jobs and no more).
Other differences
The SEPH employment estimates come from a census of payroll deduction records from a particular reference week, normally the last seven days of the month. There are several types of potential survey errors (for example, an employer might transcribe his number of employees incorrectly, or might fail to report), but there is no sampling error. In certain cases SEPH excludes employees on strike, lockout, or layoff during the entirety of the reference week. The LFS estimates are quite different. They come from a sample of households and are subject to substantial sampling error in addition to other types of survey errors. The LFS reference week is usually the one containing the 15th day of the month, unlike in SEPH’s case. There is no way to measure the differences between the two employment estimates originating in these and some other variations in survey design and method.
The big picture
I asked Statistics Canada for annual data from 2001 to 2024 quantifying four of the sources of difference referred to above: self-employed persons, industries out of scope in one or the other survey, absent and unpaid employees, and multiple job holders. I also obtained LFS and SEPH total employment data from the Statistics Canada databank, with the territorial component of the SEPH data excluded. Looking at the total LFS-SEPH difference and netting out the four factors just mentioned explaining the difference yielded a fifth, residual or “other” factor. These factors are all depicted in Chart 1.
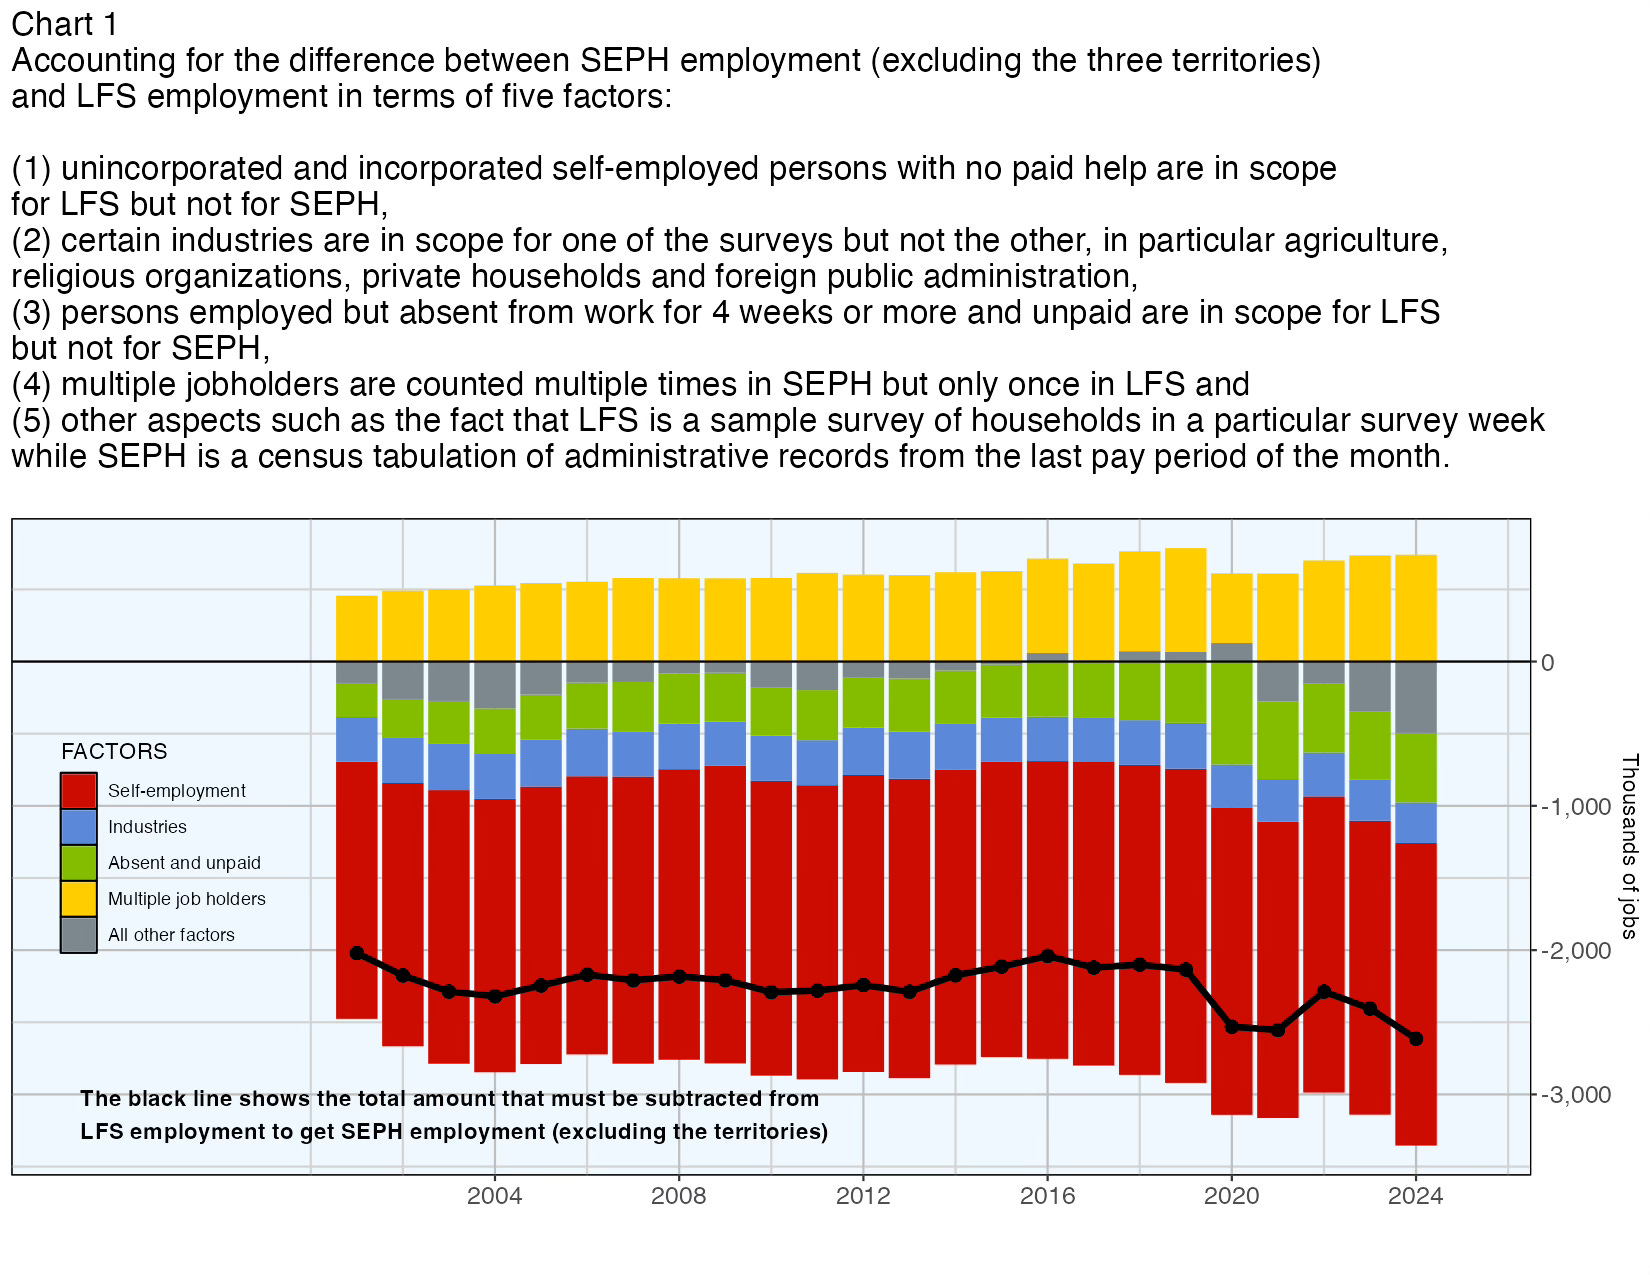
The black line in the chart shows the amount that has to be subtracted from LFS total employment to obtain SEPH total employment. In 2024, for example, that amount was 2,613,708 employees. It can be seen that self-employment (red bars) accounts for the largest share of the difference. The variation in industries covered by the two surveys (blue bars) is comparatively small and stable. The share of the difference due to absent and unpaid employees (green bars) is a bit larger and has been growing. It was especially large in 2020, at 712,835, as a result of the COVID pandemic. Multiple job holders account for the second largest share of the difference and their number has also been growing, although it was sharply lower during the pandemic year.
The remaining factor identified in Chart 1 is the residual component. It is typically the smallest component and while usually negative has also been a positive factor in some years. As it happens, this unexplained “all other factors” piece of the puzzle was the largest it has ever been in 2024.
Chart 2 shows these unaccounted for differences, inverted so positive numbers are amounts that must be subtracted from the LFS employment estimate to obtain the SEPH employment estimate. The mean residual amount is 137,689 employees and the standard deviation is 149,665 employees.
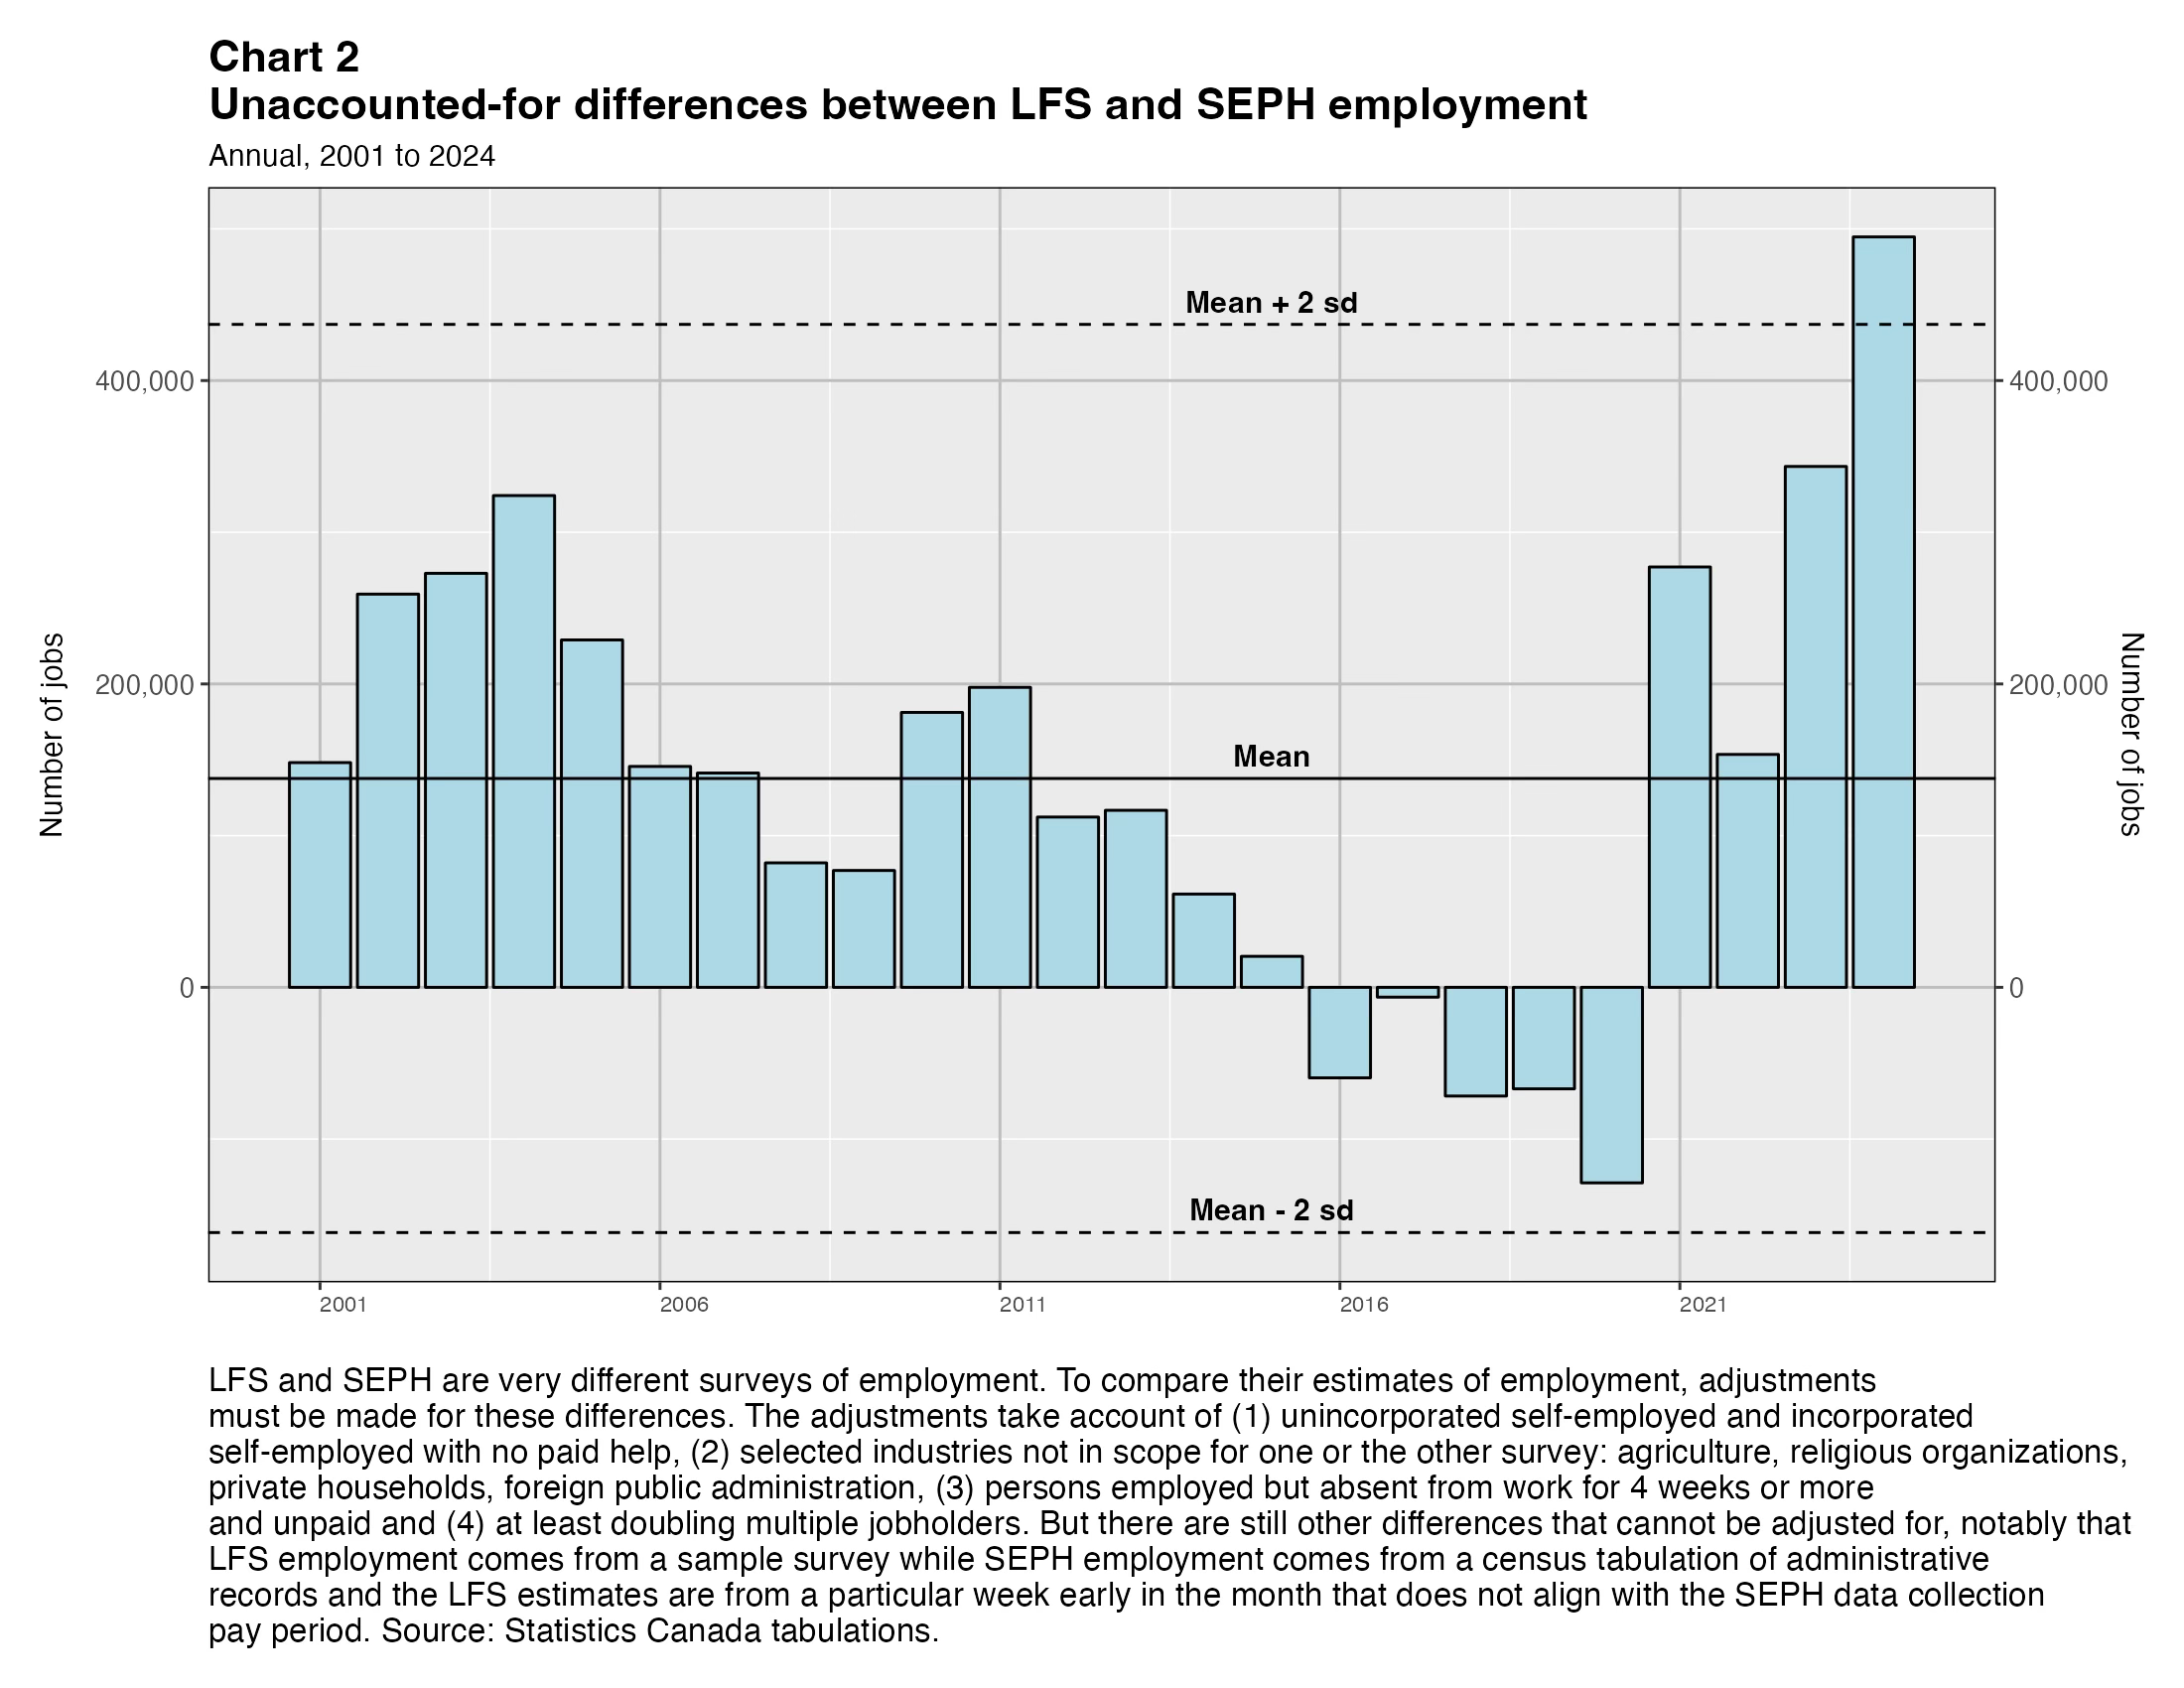
It is intriguing that the largest residual amount, 494,689 employees, occurred in the final year, 2024. It is the only one of the 24 residuals that was greater than two standard deviations from the mean.3 One can speculate about what other factor(s) might have made it necessary to subtract a larger than expected residual amount from the LFS estimate to arrive at the SEPH estimate in 2024. A factor that comes to my mind is the impact of the 12-month moving-average that is applied to the non-permanent residents component of the LFS target population. This moving-average had the effect of slowing LFS employment growth somewhat in the years of the post-COVID non-permanent resident surge, but had the opposite effect as the surge subsided in 2024.
Conclusions
LFS and SEPH are different in so many ways. There is no reason to expect them to yield the same employment estimate in any given period. Nevertheless it is remarkable just how similar their employment trends have been over time. This paper has identified major factors accounting for the total difference between the two employment estimates. As shown in Charts 1 and 2, these four factors account for most of the difference and in some years virtually all of the difference. Nevertheless there remains a residual “all other factors” amount that is inherently unexplainable. In most years it is small compared to the other four factors, but it has been larger in the most recent years, especially in 2024. This may be related in part to the difficulties the LFS has faced as a result of the unexpected billowing of non-permanent residents after the COVID pandemic eased.
For information about the concepts and methods of the LFS see Guide to the Labour Force Survey, 2025 edition, Statistics Canada catalogue 71-543-G.
For information about the concepts and methods of the SEPH see Guide to the Survey of Employment, Payrolls and Hours, 2025 edition, Statistics Canada catalogue 72-203-G.
There is no reason to believe this residual is normally distributed, but if it was normal one would expect about one out of the 24 to be outside this range.