Canada's recent strong population growth in perspective
An exploration of the relative roles of births, deaths, immigration, emigration and non-permanent residents in ten charts
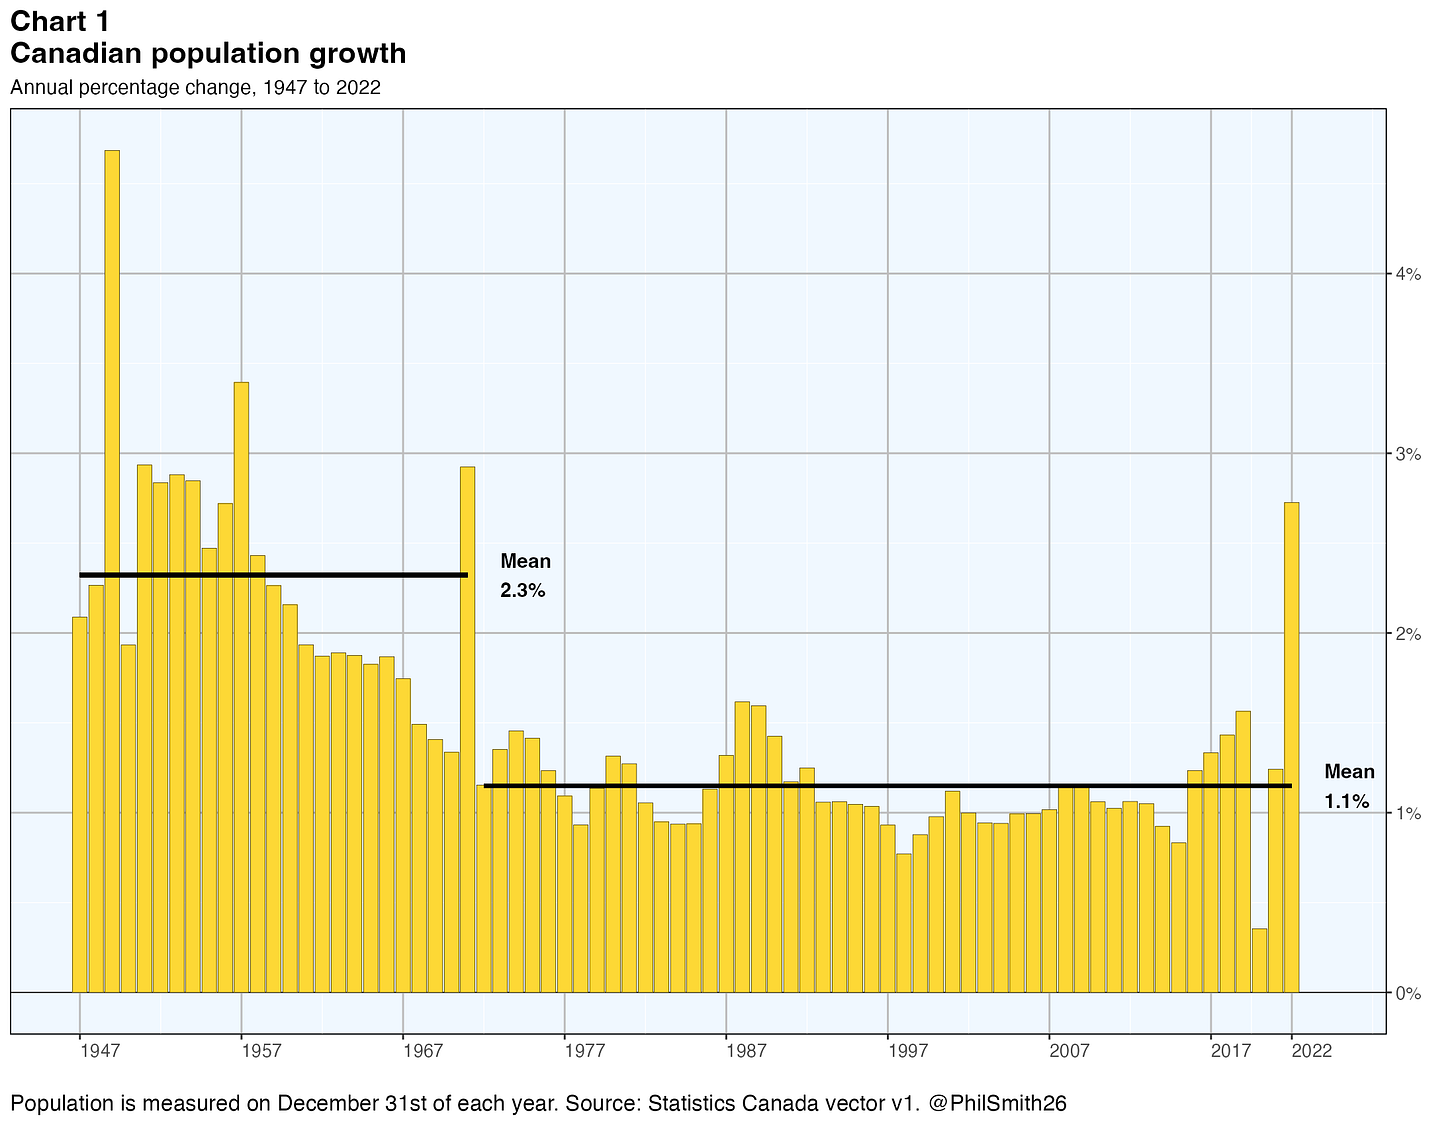
Canada’s population12 increased 2.7% in 2022, a sizeable amount. This was more than double the 1.1% mean annual growth rate since 1972. It even exceeded the 1947-1971 average advance of 2.3%. The rates of increase in 2016-2021 were also above average (excluding the pandemic year 2020), although not by nearly as much as in 2022. What’s going on here? Why is Canada’s population upsurging?
The change in population from one year to the next can be viewed as the sum of the following additive components:
Births. Quite obviously, the more fertile the population, the more will it grow.
Deaths. The higher the death rate, the less rapidly the population will expand. Indeed, if the death rate is high enough the population could decrease.
Immigration. The more immigrants to Canada are permitted by the authorities in a given year, the faster the population will rise.
Emigration. When Canadians emigrate to other countries it implies a reduction of Canada’s population.
Returning emigrants. If a person who emigrated in a previous year returns to Canada, it implies a population increase.
Net non-permanent residents. In any given year there are people in Canada who reside in the country on a temporary basis. They could be foreign students studying in Canada, or foreign residents with temporary Canadian work permits, or persons claiming refugee status whose claims have not yet been adjudicated.
Net temporary emigrants. Just as some foreign residents come to Canada with student visas or temporary work permits, so some Canadian residents go to other countries with student visas or temporary work permits there. These temporary emigrants reduce Canada’s population while they are away.
The remainder of this article examines each of these components in turn, considering its role in the overall growth of Canada’s population.
Births
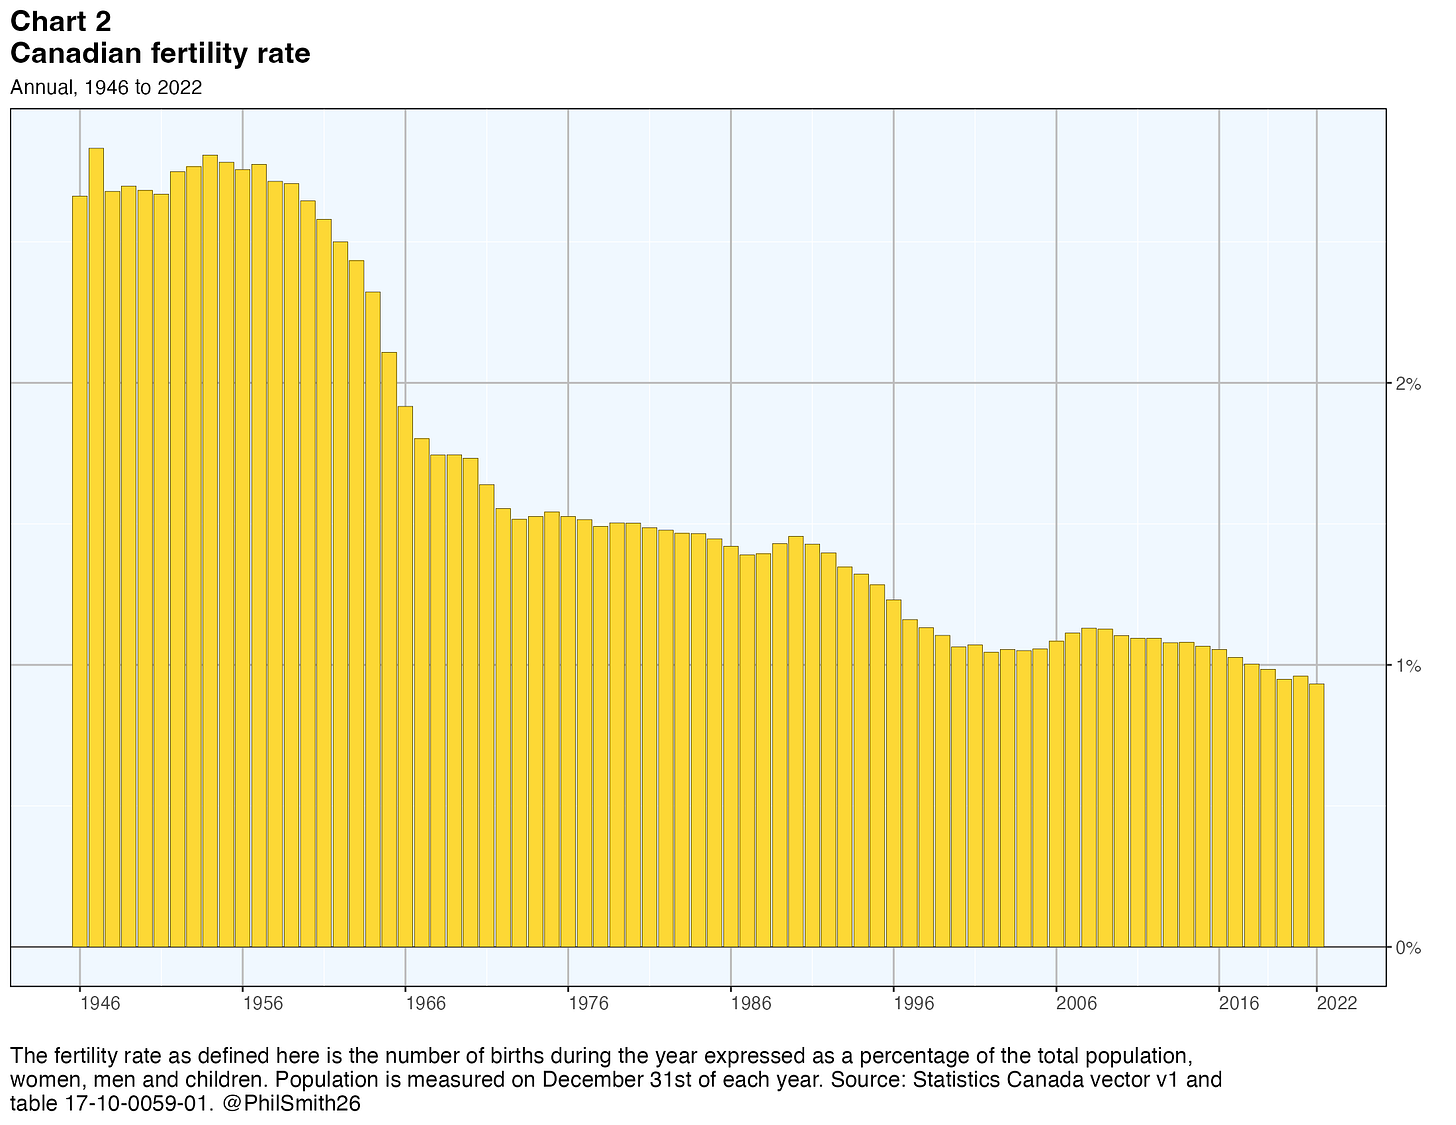
The number of births in a given year, expressed as a percentage of the female population, is usually called the fertility rate. Here though the rate is defined relative to the total population, women, men and children. The postwar evolution of the fertility rate defined this way is shown in Chart 2.
The rate was quite high in the aftermath of World War II as soldiers returned home, households were reconstituted or created anew, and families expanded. Not quite 3 out of 100 Canadians were giving birth and that 100 includes men and children as well as adult women! But the rate began to decline in the late 1950s and has generally continued to do so ever since.
The advent of the oral contraceptive pill in the 1950s was and remains a key factor in this decrease. It allowed parents to plan the size of their families and generally speaking, this has meant smaller average family size. Another factor of equal if not greater importance has been the change in the societal view of women’s role in the economy and elsewhere. The modern woman often wants a career outside the home, just like most men, and female labour force participation rates3 have risen very substantially. In January 1976, when the modern Labour Force Survey began, the female participation rate was just 45.4% while the male rate was 78.0%. In April 2023 the corresponding rates were 61.7% and 69.7%.4
The age structure of the population is another important factor affecting the fertility rate and since the median age has been rising in Canada for quite some time, this has tended to reduce fertility. It was 26.2 years in 1971 and 41.0 years in 2022.5
There have been no recent surprises in the annual fertility rate, which continues to trend gently downward and was 0.9% in 2022. This of course has a slowing effect on the rate of population growth.
Deaths
The death rate is simply the number of deaths within the population in a given year, expressed as a percentage of the population. It is affected by the advancement of medical science and better (or worse) behaviours such as the extent of smoking within the population. The demographic structure of the population is also a key factor since the probability of a person’s death in a given year depends very much on his or her age. As mentioned, the Canadian population median age is rising and this tends to raise the average death rate.
The death rate fell between 1946 and around 1980, was fairly stable for the next three decades and began edging upward thereafter. It took a substantial jump in 2020, reflecting the impact of the COVID-19 pandemic, and remained higher in 2021 and 2022. Recent statistics indicate the cumulative pandemic-related deaths to be over 52,200 as of May 2023.6
COVID-19 deaths aside, the recent upward trend in the death rate is likely tied most closely to the aging of the population as the median age rose a full year over the last decade. Like the declining fertility rate, the rising death rate has a retarding effect on the rate of population growth.
Immigration
The gross immigration rate, ‘gross’ because emigration is not netted out, has been less stable than the birth and death rates, sometimes being under 0.5% and occasionally over 1%. It was generally high following the war and then began to cycle down and up. The rate was more stable at around 0.75% between 1990 and 2019 before plunging in the pandemic year, when border-crossing restrictions were in effect, and rebounding substantially in 2021 and 2022.
Immigration levels are at the discretion of the government. Its 2023-2025 Immigration Levels Plan was tabled in Parliament on November 1, 2022 with the following permanent resident admission targets: 465,000 in 2023, 485,000 in 2024 and 500,000 in 2025. This implies a gross immigration rate of about 1.2% in those years, similar to what was realized in 2021 and 2022.
Emigration
The gross emigration rate is low when compared to the gross immigration rate. It was around 0.4% in the postwar years, rose to over 0.5% in the mid-1960s as air travel became easier, and then began a decline. It has been well under 0.2% for the past 14 years. So it seems fair to say that emigration is not currently a big factor in Canada’s population growth.
Returning emigrants
Canadians who emigrate to other countries may be able to return to Canada depending on their individual circumstances, including their citizenship, residency status and length of time spent living abroad. There are likely to be tax consequences and in some instances things can get complicated.
Since the gross emigration rate has been comparatively low for many years, the stock of emigrants who might consider returning to Canada is not very large. As seen in Chart 6, the returning emigrants rate was highest in the mid-1970s at a little over 0.15%, then feel to around 0.05% by the late 1980s and in the early 2000s rose up to the current rate of around 0.10%. Note that statistics on returning emigrants are available only from 1972 forward.
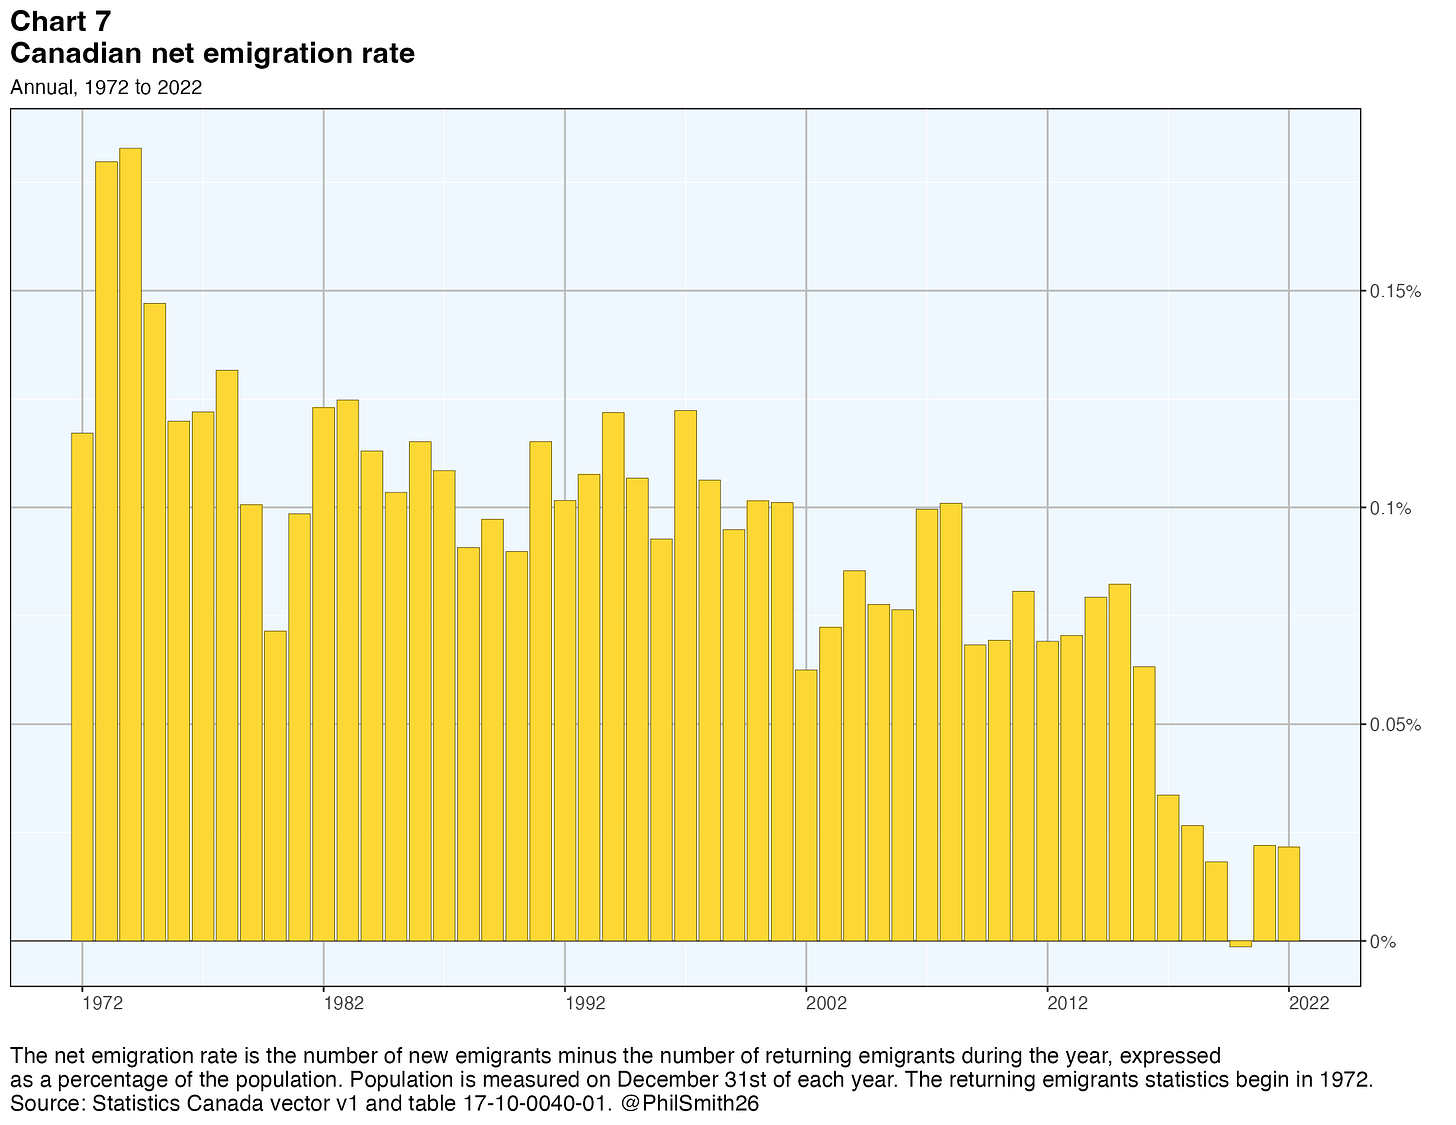
If the number of returning emigrants in a given year is subtracted from the number of new emigrants in that year, one obtains the net emigration rate. As seen in chart 7, this net rate was never very high and was just 0.02% of the population in 2022. So again, emigration is just not a significant element in the explanation of Canadian population growth.
Net immigration rate
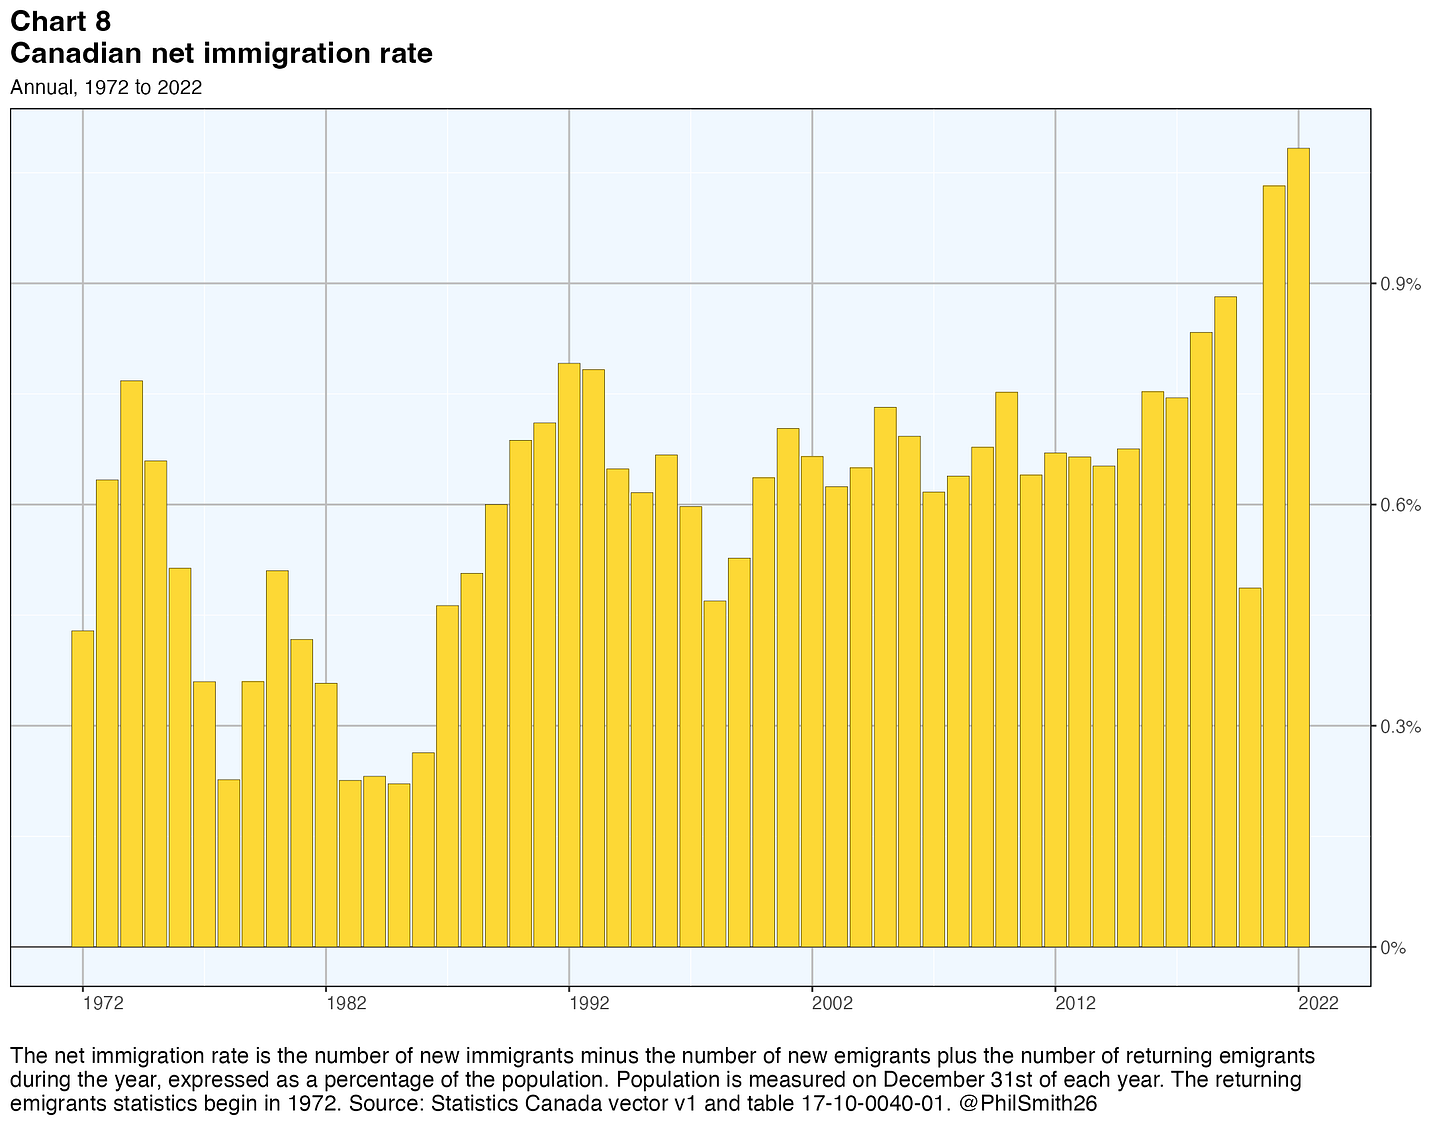
While discussing immigration and emigration, it is worthwhile to consider one additional concept that brings the two together: the net immigration rate. This is the gross immigration rate minus the gross emigration rate plus the returning emigrants rate. It is shown in Chart 8.
While the gross immigration rate is shown in chart 4 for the period 1946 to date, the net immigration rate statistics are available only for the period 1972 to date. By comparing charts 4 and 8 it can be seen that the general time series pattern from 1972 to date is very similar. The main difference is that the net immigration rate is almost always a bit lower than the gross immigration rate, lower by the size of the net emigration rate. The net immigration rate was 1.1% in 2022, up from 1.0% in 2021 and 0.5% in 2020.
Net non-permanent residents rate
The net non-permanent residents rate is where things got very interesting in 2022. This rate is the number of persons residing in Canada only temporarily, during all or part of the year, divided by the population.
Non-permanent residents come in three varieties. First, there are students who come to study at a Canadian university with a student visa. They reside in Canada, possibly with their families, but only while their studies are in progress. They are neither citizens nor immigrants.
Second, there are persons from other countries who come to Canada with a work permit issued by the Canadian government allowing them to work at a specific job for a specific employer. Over time, the government has expanded or reduced the number of such work permits issued, depending on the extent of perceived labour shortages in different industries and/or parts of the country at different periods of time during the year.
Third and finally, there are refugees who the government defines this way: “Refugees are people who have fled their countries because of a well-founded fear of persecution. They are not able to return home. They have seen or experienced many horrors. A refugee is different from an immigrant. An immigrant is a person who chooses to settle permanently in another country. Refugees are forced to flee.”7 Refugee claims are subject to many rules and conditions and are adjudicated by the Immigration and Refugee Board. The claimants are considered to be non-permanent residents while their claims remain unresolved.
As seen in chart 9, the net non-permanent residents rate was over three times higher in 2022, at 1.5%, than it had ever been before. A large part of this surge was accounted for by Ukrainian refugees from the war launched against them by Russia in February 2022. These refugees are seeking temporary resident status under the Canada-Ukraine Authorization for Emergency Travel program. As of the end of April 2023, 1,014,647 applications had been received from Ukrainians, 698,398 had been approved and 216,326 had arrived in Canada, equivalent to 0.5% of the Canadian population. Unfortunately it is not possible, in the available statistics, to break down more completely the total net non-permanent residents total into it components.
Net temporary emigrants
The final, and rather small, piece of the puzzle consists of Canadians temporarily abroad on student visas or temporary work permits. As shown in chart 10, the net temporary emigrants rate is relatively small and has been around 0.075% since 2012 (except for the pandemic year).
Conclusion
So what this boils down to is that Canada’s population increased by 1,050,110 persons in 2022, the largest such annual increase ever, and by a substantial margin. This increase was accounted for in the following manner:
369,036 births, accounting for 35.1% of the total population increase;
326,483 deaths, or -31.1%;
437,180 new immigrants, or 41.6%;
8,569 net emigrants, or -0.8%;
607,782 net non-permanent residents, or 57.9%; and
28,836 net temporary emigrants, or -2.7% of the total population increase.
Canada’s population is not the number of Canadian citizens. Rather, it is the number of people residing in Canada, broadly speaking. More specifically, as Statistics Canada defines the term, Canada’s population includes: Canadian citizens and immigrants with a usual place of residence in Canada; Canadian citizens and immigrants who are abroad on a military base or attached to a diplomatic mission; Canadian citizens and immigrants at sea or in port aboard merchant vessels under Canadian registry; and, since mid 1991, non-permanent residents of Canada. The population does not include foreign persons working in their countries’ embassies in Canada.
Statistics Canada’s quinquennial Census defines the size of the population for a given year as it is on July 1st of that year. However, in this article the population is defined as it is on December 31st. Defined this way, the population coming from the previous year is augmented by all the various contributing elements in the current year, such as births, deaths and immigration, yielding the population at the end of the year or, more simply, the population of that year.
The participation rate is defined as the percentage of the labour force population that either has a job or is looking for one (in other words, is unemployed). The labour force population is defined as all civilian non-institutionalized persons 15 years of age and older.
Statistics Canada table 14-10-0287-01.
Statistics Canada table 17-10-0005-01.
Government of Canada, https://health-infobase.canada.ca/covid-19/
Government of Canada, https://www.canada.ca/en/immigration-refugees-citizenship/services/refugees/canada-role.html


Fascinating to see the change in median age from 1971 to today