
An interesting and not widely understood aspect of the Labour Force Survey

1. Introduction
Canada’s Labour Force Survey (LFS) is a vital economic bellwether. The survey provides a very detailed portrayal of the labour market on a monthly basis and in an exceptionally timely way. It has a solid methodology that has been proven over many decades.12
The main focus of the survey is to provide monthly estimates of various rates — the unemployment rate, the labour force participation rate, the employment rate and numerous growth rates such as that for employment and hours worked — and to do it in a way that allows slicing and dicing by sex, age group, province and many other dimensions.3 The published survey results also provide economy-wide aggregates for the LFS target population, the labour force, employment and unemployment and these are widely used in macroeconomic analyses.
What most people do not know is that the LFS population totals are derived to meet the specific objectives of the survey and are not to be used as official population estimates.4 This paper explores the differences between the LFS population totals on the one hand and the official population estimates that come from Statistics Canada’s demography program on the other.
2. The LFS target population
To understand the labour force survey one must begin by appreciating the limitations of its scope. The estimates do not apply to all Canadian residents, but rather are for a more restricted group. That group differs from Canada’s total population of 41,012,563 people as of April 1, 2024 by excluding the following:5
Persons under 15 years of age,
Persons living in one of the three territories,
Residents of regions that are extremely remote or of extremely low population density,
Full-time members of the Canadian forces,
Persons living on reserves and other First Nations settlements and
Persons living in prisons, care facilities and other live-in institutions.
It also differs from the total population in the way it includes non-permanent residents (NPRs) — asylum claimants, persons with student visas and those with temporary work permits. The official Canadian population statistics include the best available quarterly estimate of the number of NPRs whereas the LFS target population includes a 12-month uncentered moving-average of the best available monthly estimate.
3. Non-permanent residents
Statistics Canada began applying the moving-average to the NPR component of the LFS target population some years ago because the number of NPRs in the country was volatile from month-to-month and difficult to estimate within the very short time-frames involved in producing and releasing the LFS estimates. Moreover, until recently NPRs were a relatively small proportion of the population. By employing the moving-average, Statistics Canada was aiming to prevent the tail from wagging the dog, so to speak.
Of course, since the number of NPRs in Canada began to surge in the post-pandemic period they are no longer a small share of the population. As of April 1, 2024 they numbered 2,793,594 or 6.8% of the population.
Chart 1 shows the difference between a monthly version of Statistics Canada’s estimates of the total number of NPRs in Canada and a 12-month uncentered moving-average of that time series.6
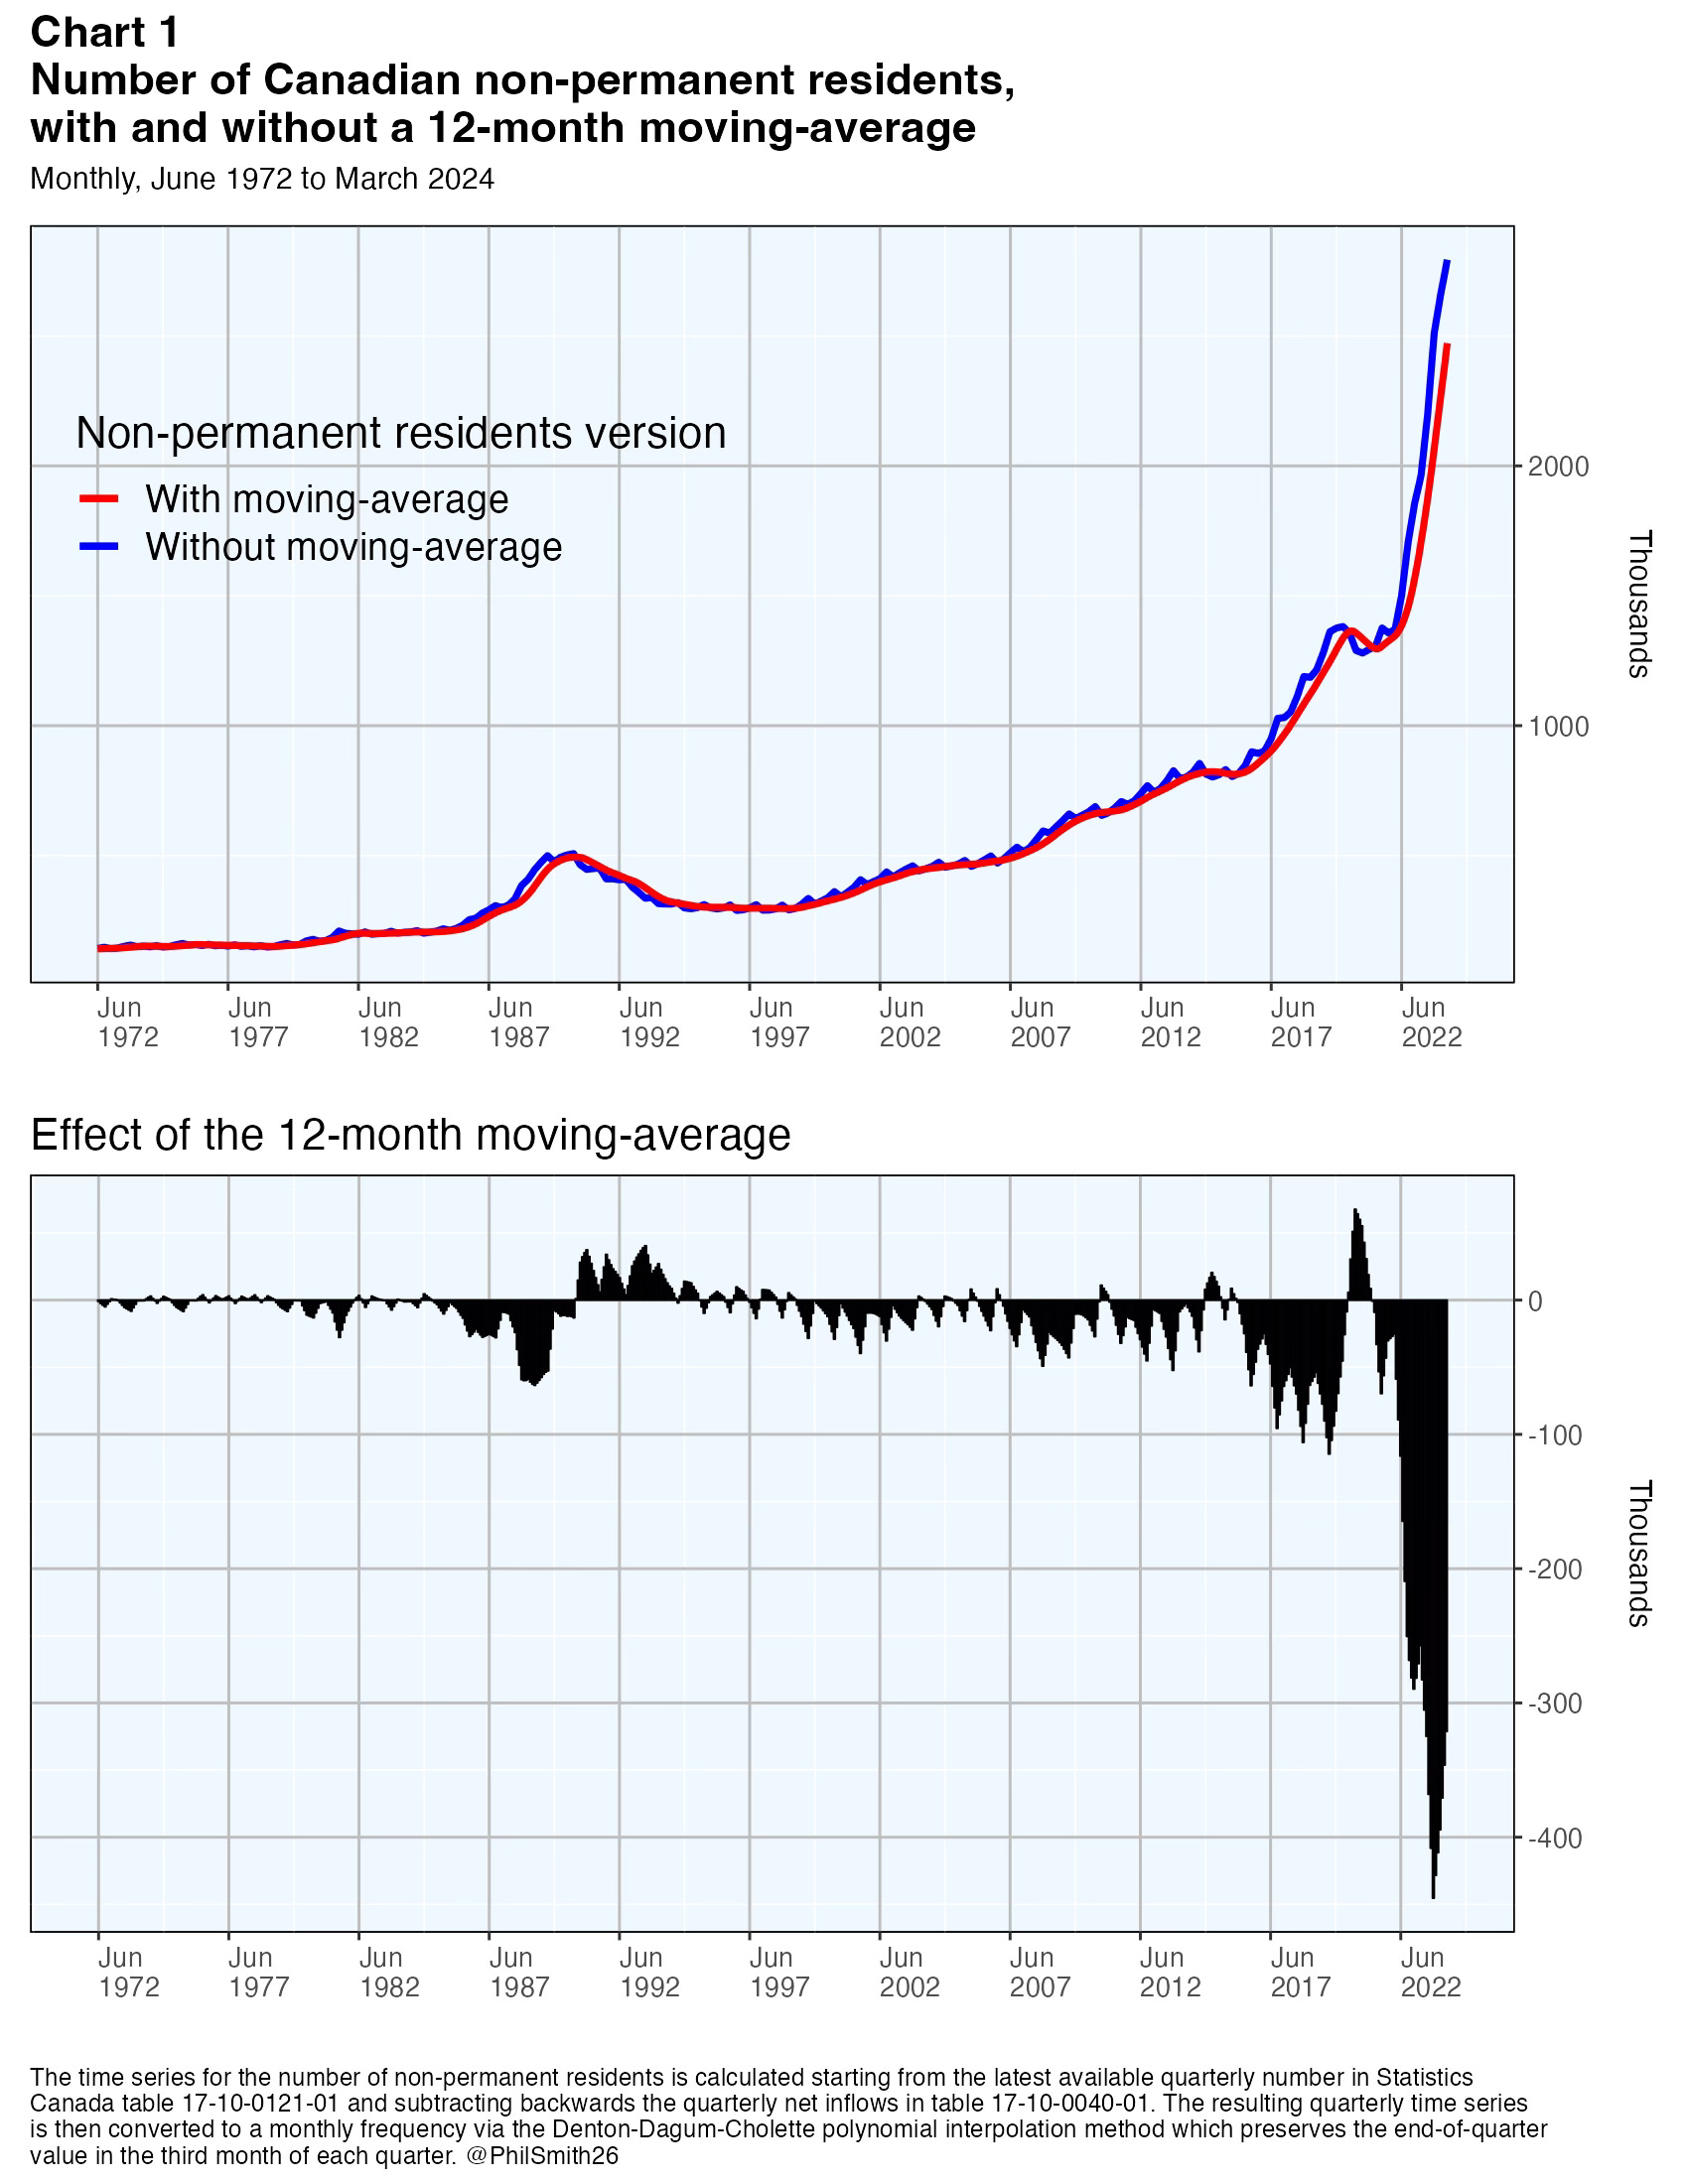
It is clear how the moving-average smooths out the volatility in the time series. But the effect of the moving-average has become much larger in the last three years. The difference between the two peaked at 445,415 persons in September 2023 and then began to decrease, reaching 321,243 in March 2024. But the 12-month moving-average of NPRs shown in Chart 1 does not apply exactly to the LFS because some NPRs are excluded from the LFS target population due to the restrictions listed in the previous section. In particular, some are excluded because they are under 15 years of age or reside in the territories or in remote areas. We explore the importance of these exclusions in the next section.
4. Non-permanent residents included in the LFS target population
The published LFS tables contain an implicit (residual) time series that is a good approximation to the actual estimate of the number of NPRs in the LFS target population. It is found in table 14-10-0084-01 which records the LFS target population, the number of landed immigrants within that population7 and the number of persons born in Canada within that population. The approximation is obtained essentially by subtracting the latter two time series from the LFS target population.
Why is this only an approximation? One reason is that the table presents monthly estimates that are three-month moving-averages rather than estimates compiled exclusively for the reference month. Nevertheless, the moving average is short and this seems a relatively minor limitation. The other reason is that the residual calculation also includes citizens of Canadian parentage, but who were born outside Canada. Statistics Canada table 98-10-0302-01 reports there were 322,530 people in this category in the census year 2021. Similarly there were 173,035 such cases reported in the 2016 census, 87,370 in the 2011 census and 78,015 in the 2006 census. Thus there has been fairly rapid growth in this citizen category in recent years, but since the LFS target population only includes persons 15 years of age and older, any adjustment for this factor would be less than 87,370 by 2024 and progressively less than that in previous years. To estimate a monthly time series for this ‘citizens of Canadian parentage, but who were born outside of Canada’ time series, the value in May 2006 was taken to be 78,015 and this value was grown backwards and forwards in parallel with the total LFS target population. The resulting monthly time series was then lagged by 15 years, since those under 15 are excluded from the LFS target population, and then subtracted from the residual time series referred to in the previous paragraph. This is our calculation of the estimated number of NPRs in the official LFS target population.
Chart 2 shows this estimate of the number of NPRs in the LFS target population and compares it to the total number of NPRs in Canada.
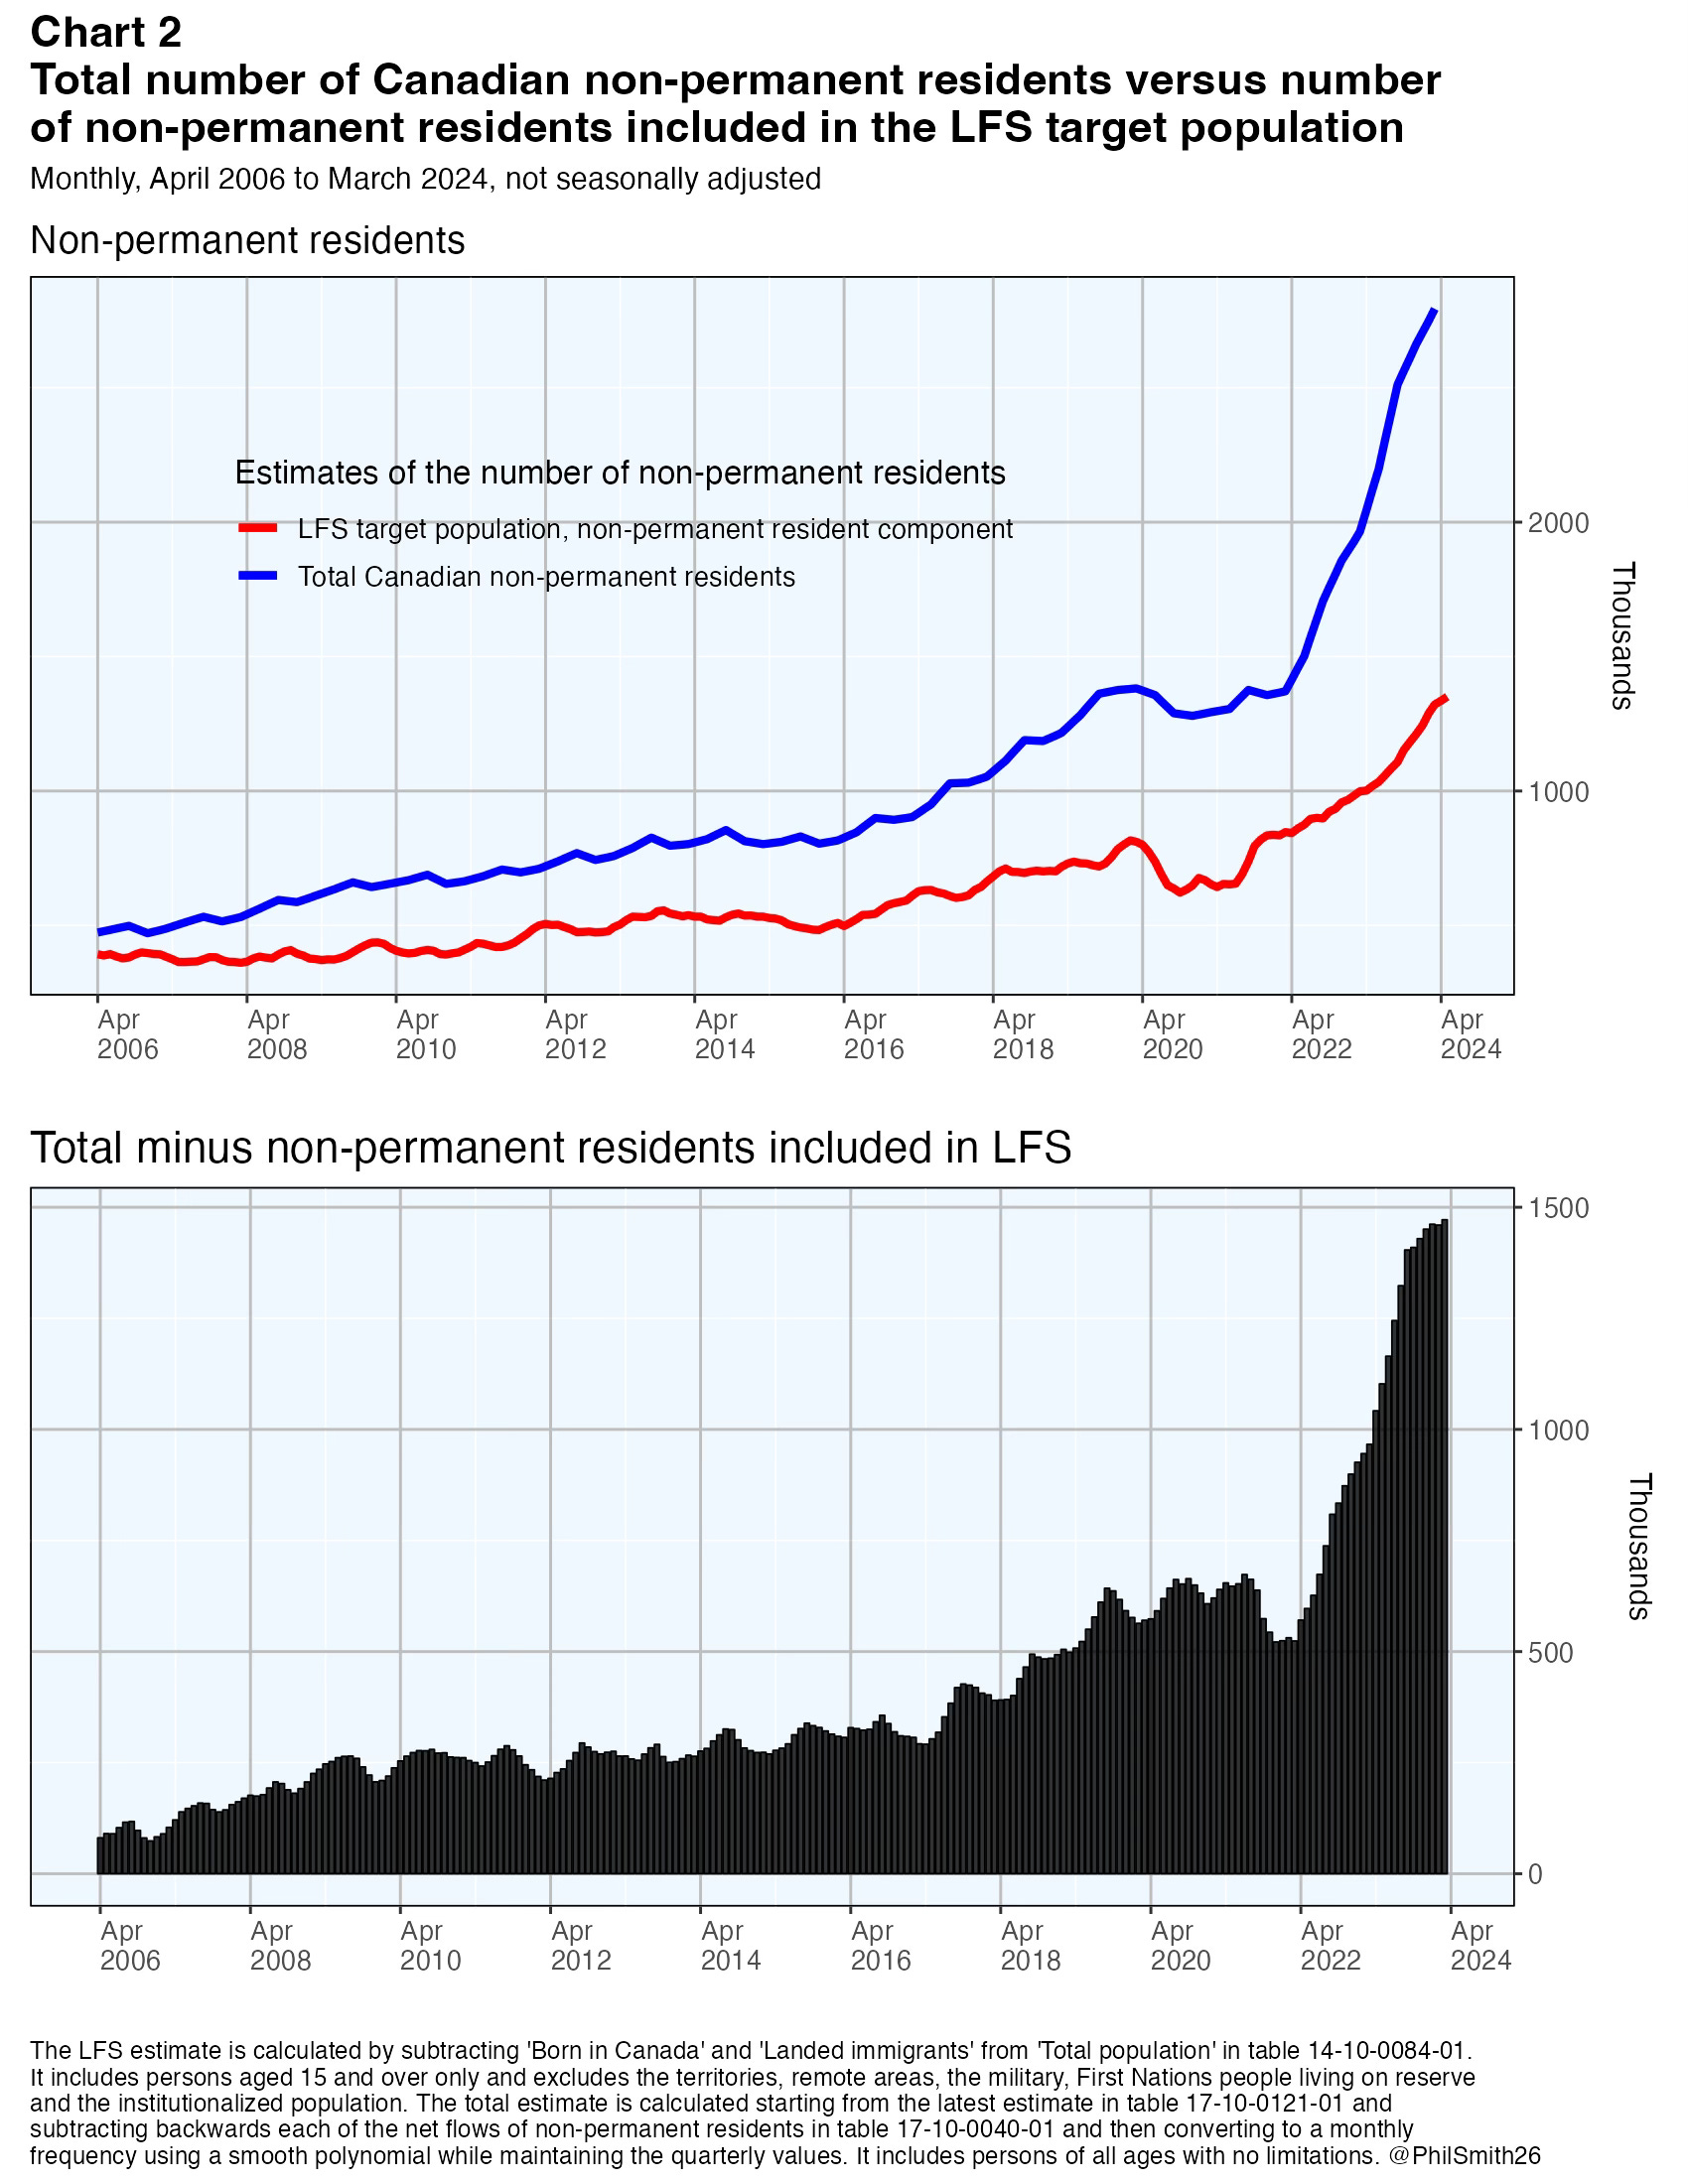
The difference between the blue line (the total number of NPRs) and the red line (the estimated number of NPRs included in the LFS target population) is, of course, substantial because of the target population scope definition, as described in section 2. What is most interesting in this chart is the sharp rise in the difference beginning in the spring of 2022. One might have expected the red line to rise at least as steeply as the blue one starting around this time since the surge in NPRs was mostly people with temporary work permits or international student visas. It seems likely most of these were older than 15 years of age and probably met the other LFS target population criteria. But the red line actually rises a lot less rapidly than the blue one so the difference increases markedly. This must surely be due to the uncentered 12-month moving average that was discussed in section 3.
Also of note in Chart 2 is that the difference appears to be near its peak at the most recent data point (March 2024). The government has stated its intention to bring down the number of NPRs in Canada from the current 6.8% of the population to around 5% within the next three years and has already taken some steps in this direction. As the two lines seen in Chart 2 come down we might expect the red line to turn down with a lag relative to the blue line as the 12-month moving-average continues to have a substantial impact.
5. Apparent size of the LFS target population exclusions
Statistics Canada table 17-10-0005-01 provides annual estimates of Canada's population by age, gender and province/territory. The estimates are for July 1 in the reference year. From this table it is possible to obtain an annual time series for the part of Canada's population that is 15 years of age and older and is not resident in the territories. This is similar to the definition of the LFS target population, the difference being the number of persons living in remote areas, military personnel, First Nations people living on reserve and persons living in prisons, care facilities and other live-in institutions.
Statistics Canada table 14-10-0017-01 provides monthly estimates of the LFS target population, unadjusted for seasonality. From this table a corresponding annual table can be created by selecting the July LFS target population estimate within each year. This series can then be subtracted from the series referred to in the previous paragraph to obtain annual implicit estimates of the number of persons in remote areas, in the military, First Nations people living on reserve and persons living in prisons, care facilities and other live-in institutions. That series is shown in Chart 3.
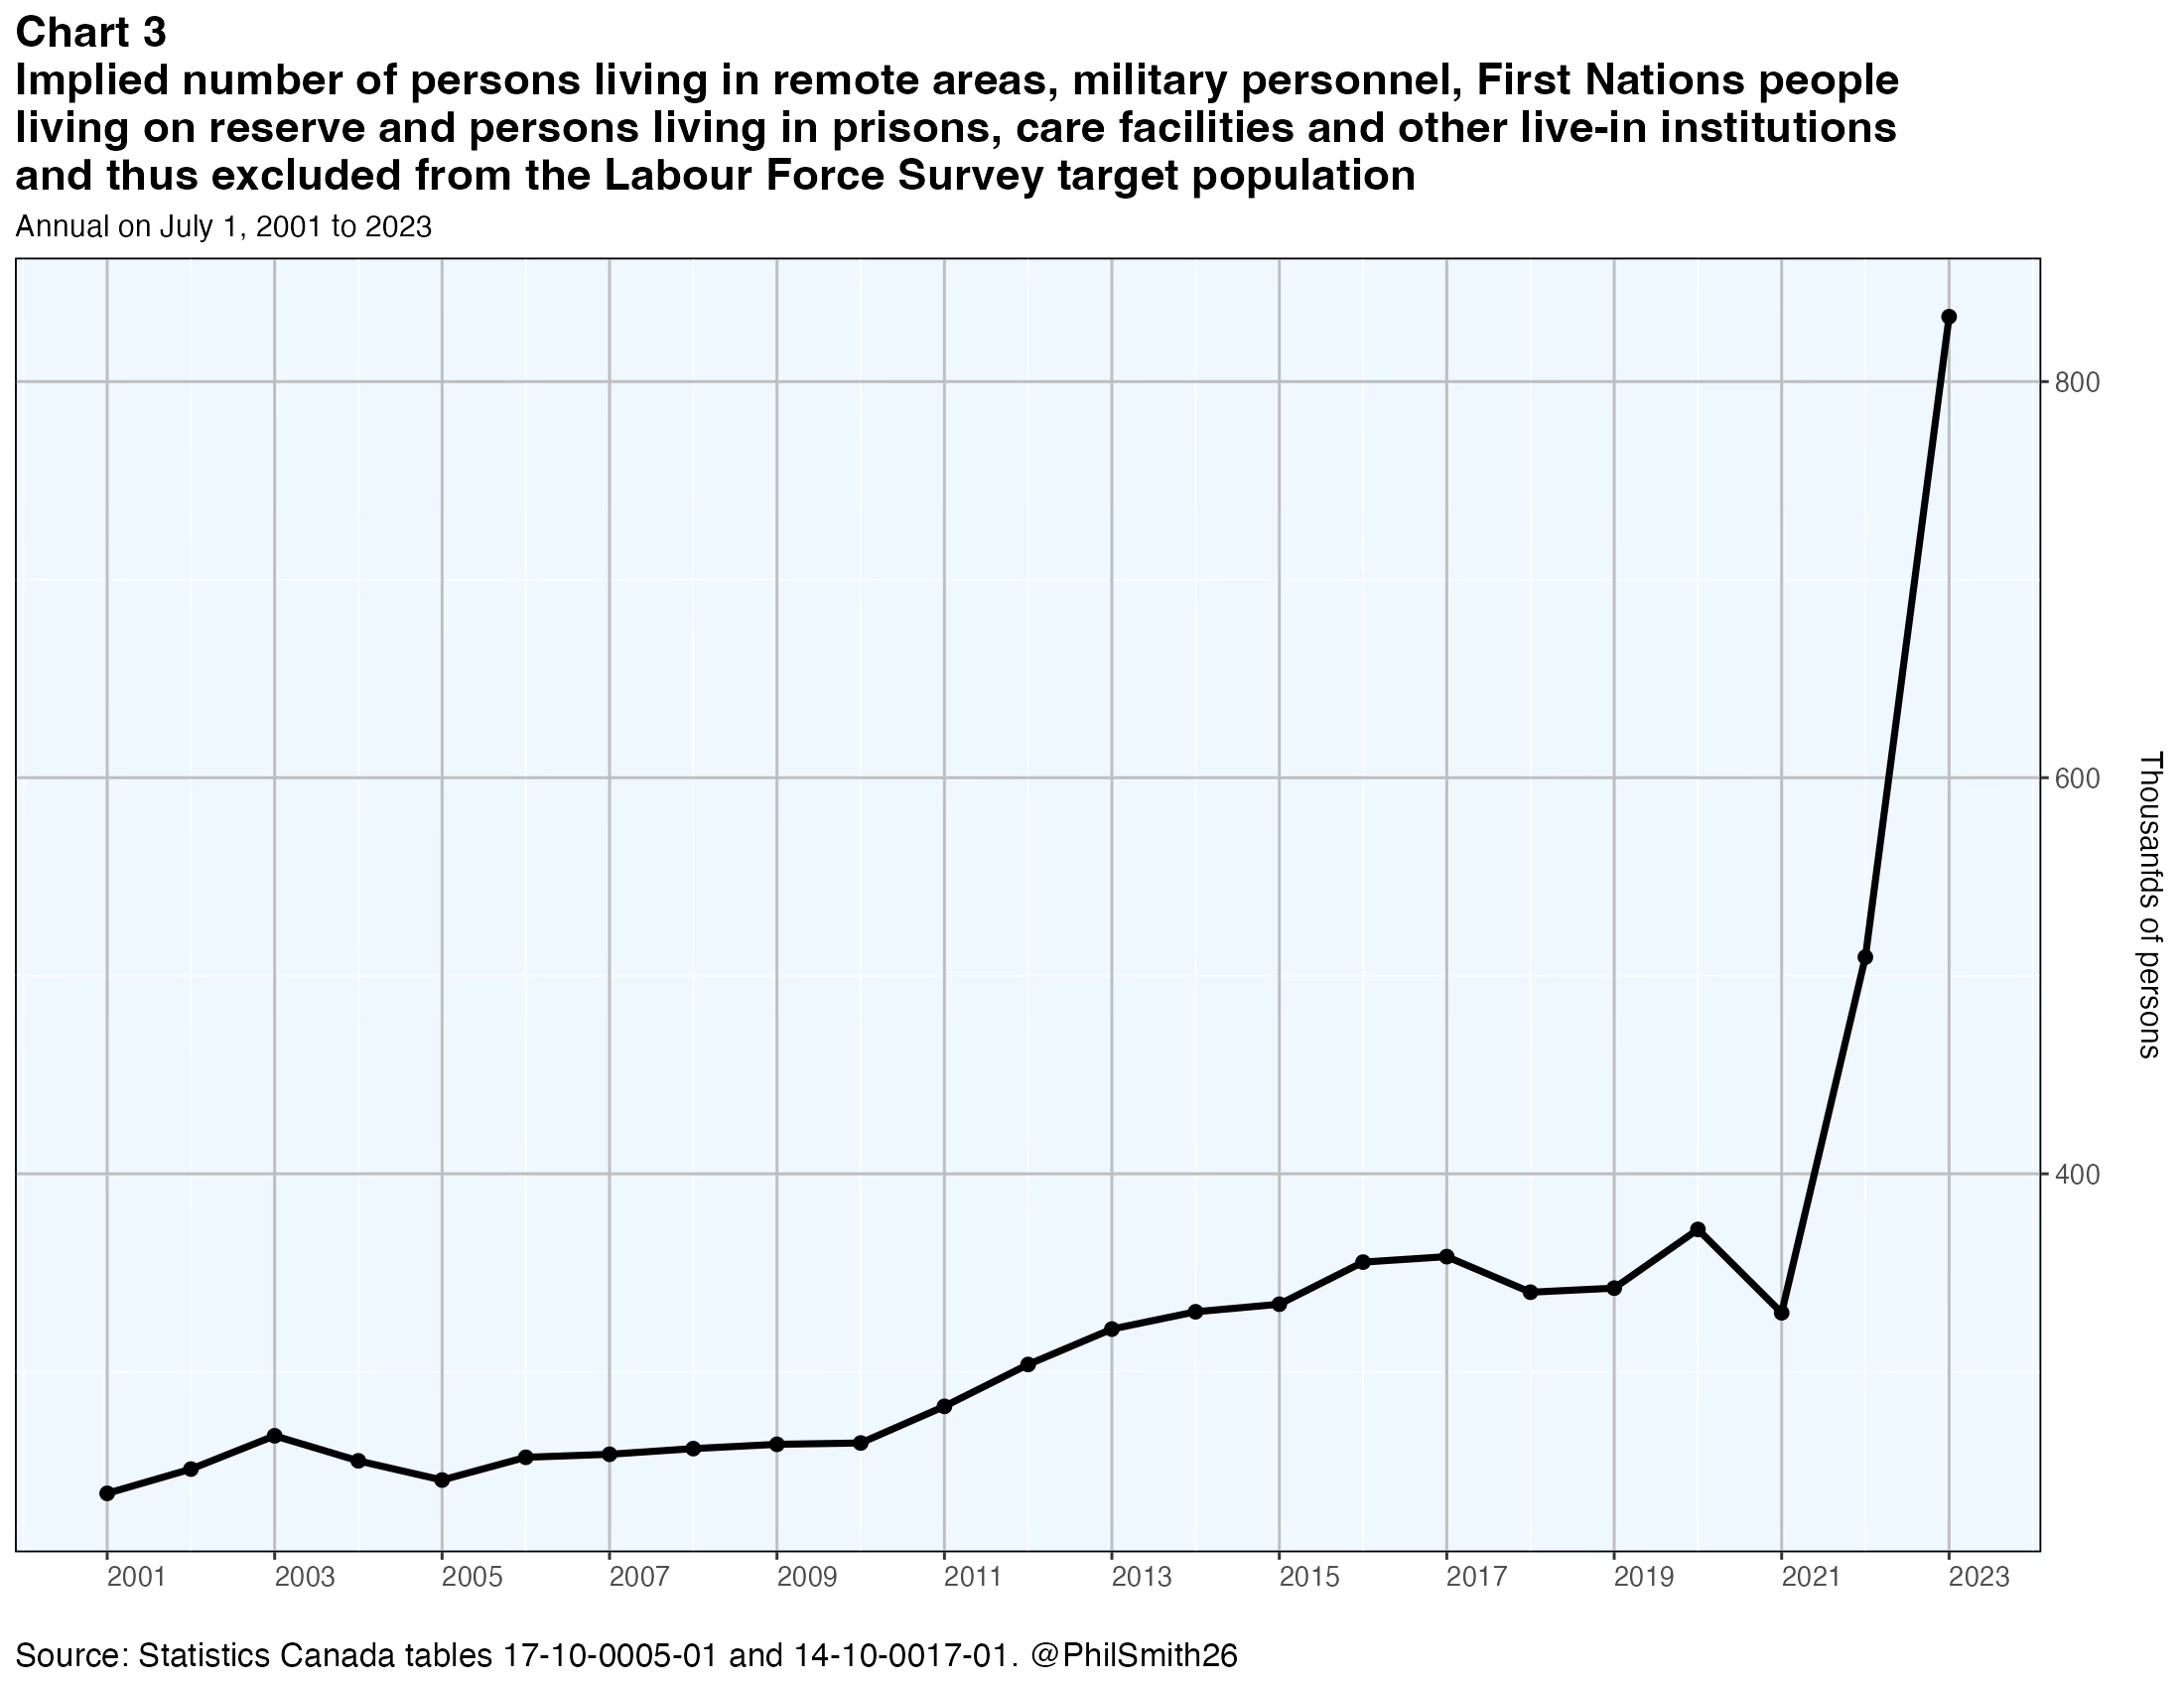
The number jumps up greatly in 2022 and 2023 and this again is related to the 12-month moving-average applied to the non-permanent residents component of the LFS target population. If the moving-average was not applied to the LFS target population, that population would be larger in 2022 and 2023 and the spike in the chart would disappear.
6. LFS target population size relative to total population
The official LFS target population was between 81.0% and 81.5% of the total population between 2011 and the onset of the pandemic in early 2020 (see Chart 4). The percentage began a gradual increase in 2018 and then an accelerated rise starting in the spring of 2020, peaking at 81.9% in the fourth quarter of 2020. Thereafter it began to drop, reaching 80.5% in the third quarter of 2023. It started to rise again in the final quarter of 2023 and the first quarter of 2024.
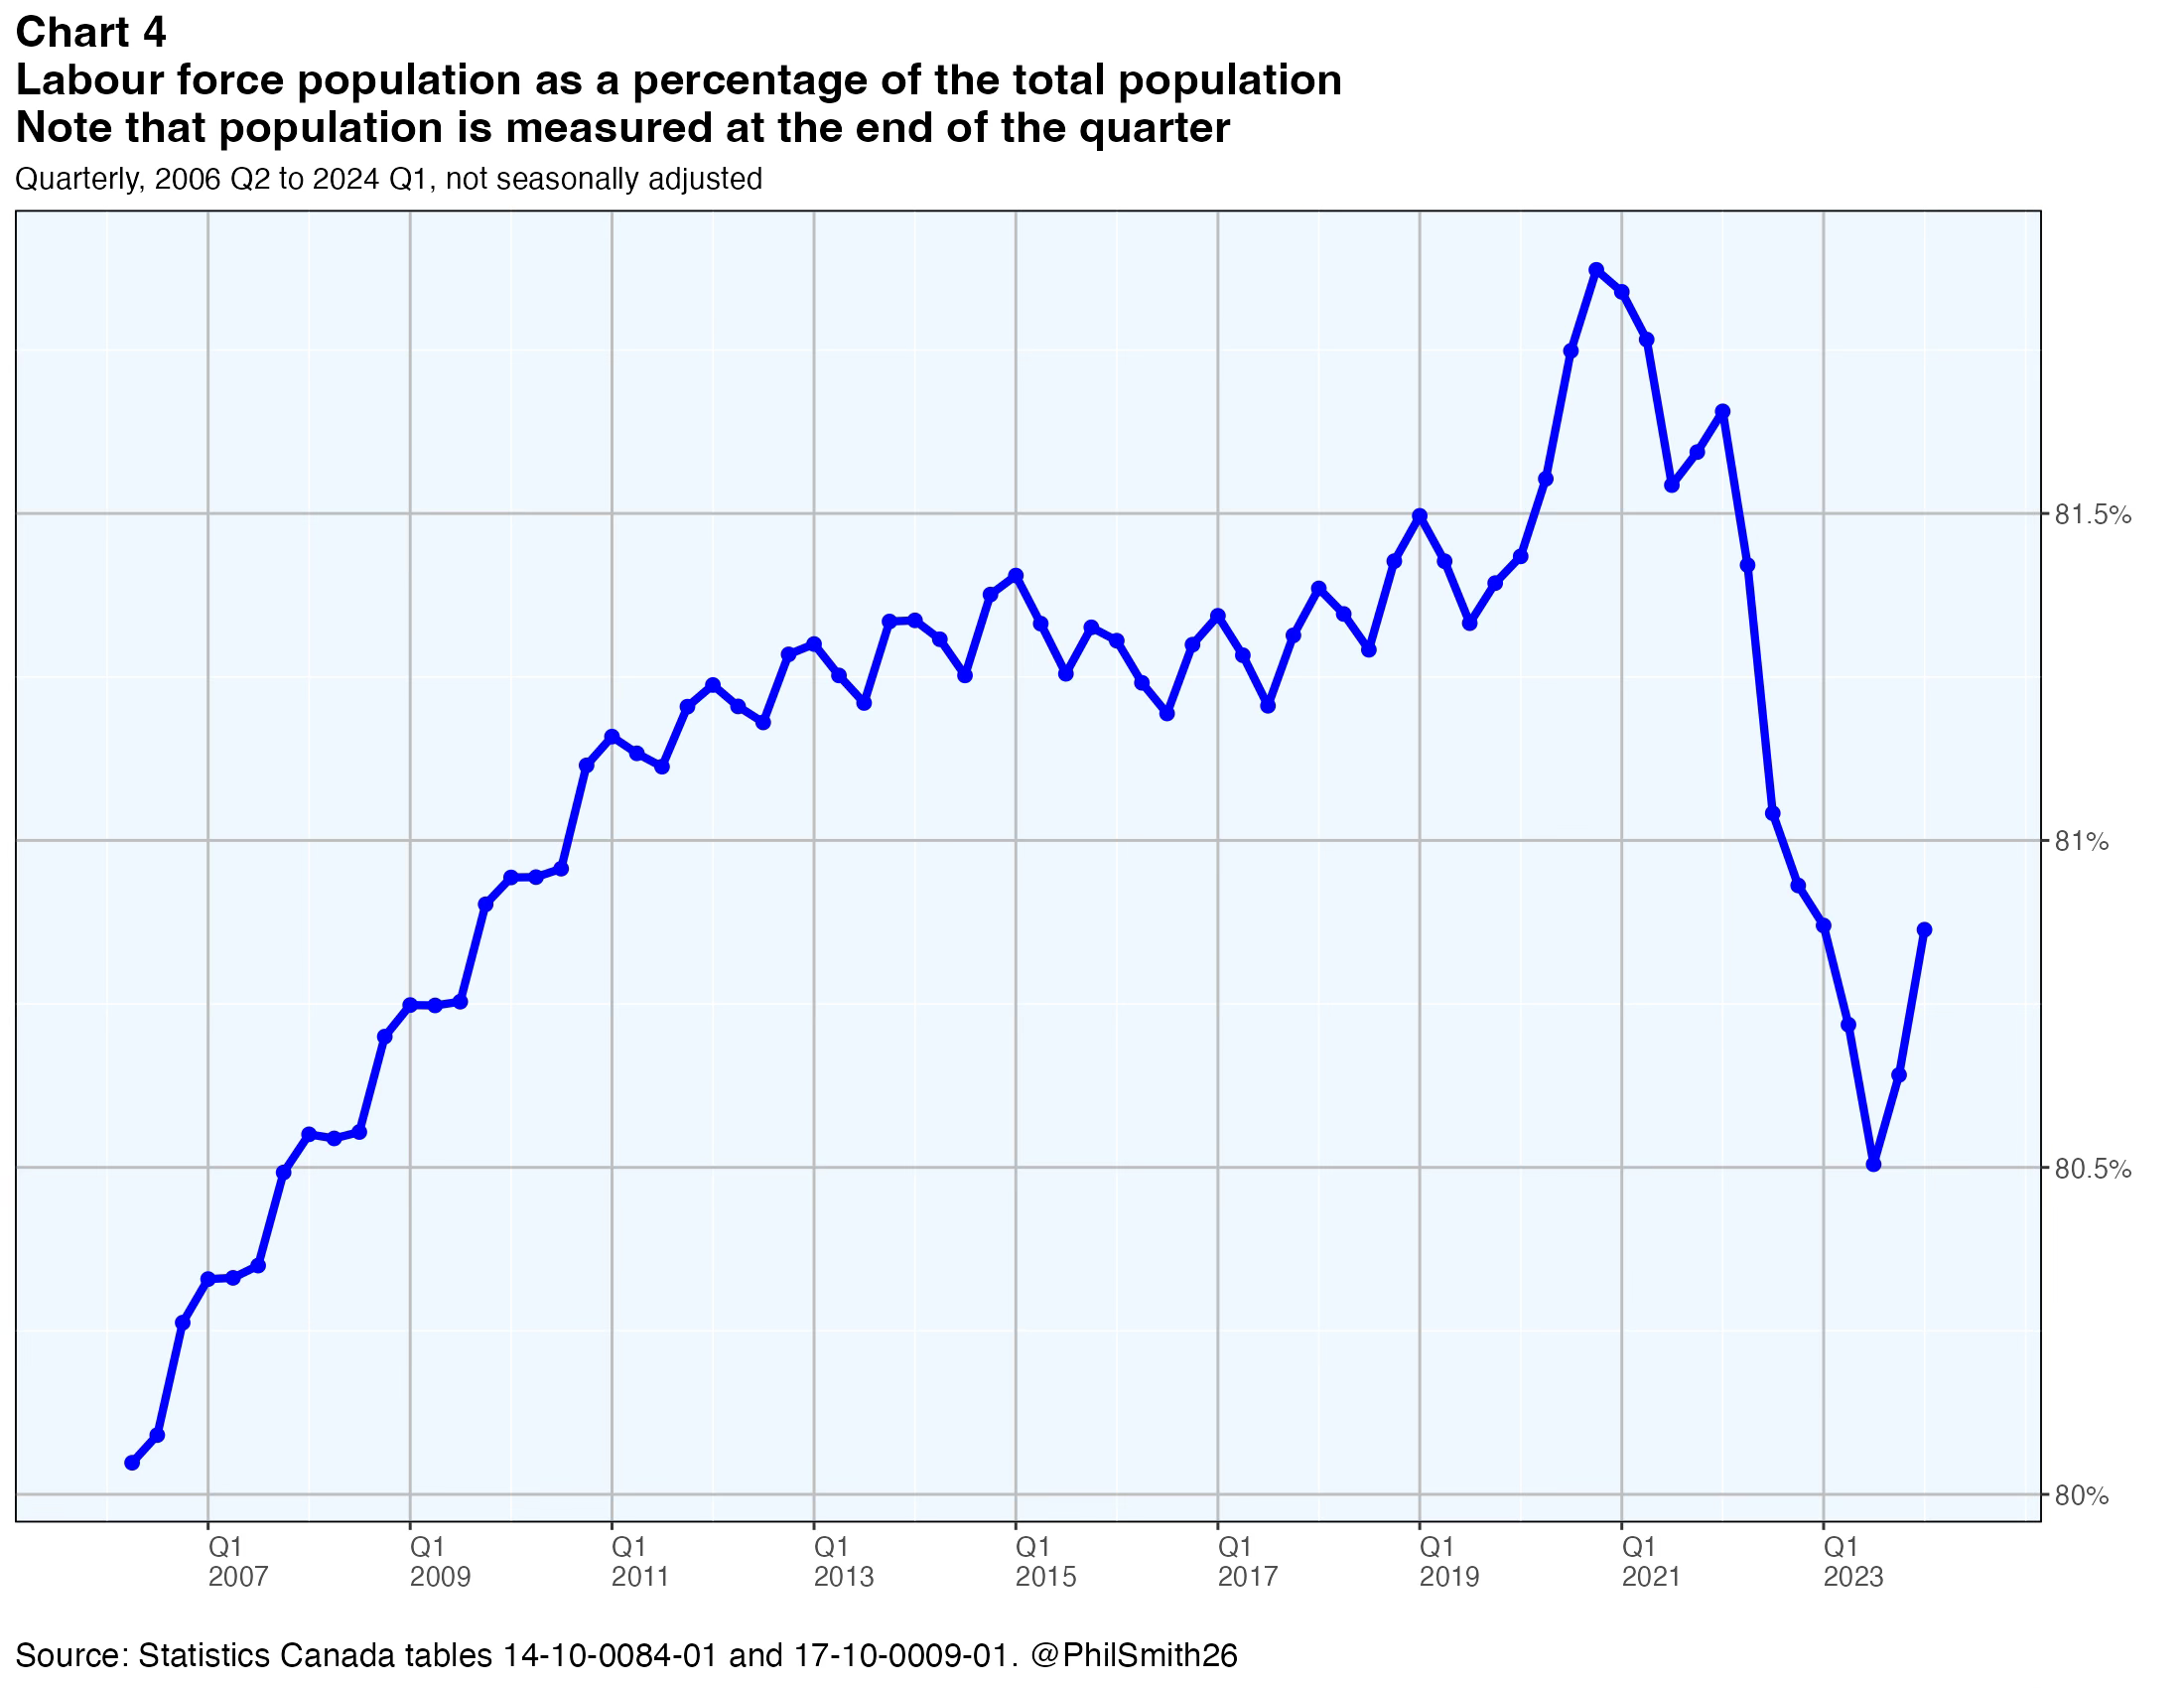
What explains these recent movements? There is no reason to suspect it is due to unusual changes in any of the six exclusions (in section 2) from the total population that normally account for the difference between the total population and the LFS target population. Rather it is, once again, the 12-month moving average that is applied to the non-permanent resident component of the LFS target population. While the total population (the denominator in Chart 4) was surging as a result of the large NPR influx in 2022 and 2023, the LFS target population (the numerator in Chart 4) was increasing less rapidly.
The upturn in the percentage shown at the end of the line in Chart 4 reflects the fact that the NPR surge has begun to decelerate. One can perhaps expect the line to continue rising as the share of NPRs in the total population stabilizes and then begins to decrease over the next three years in line with the government’s policy objective.
7. Conclusions
So what is the significance of the findings discussed above? It is that one should not interpret the LFS target population estimates as being simply the total population with the six components referred to in section 2 removed. That would have been roughly correct a few years ago, but not more recently. The 12-month moving average that is applied to its NPR component, though its effects were relatively small for many years when the NPR population was not growing as rapidly and represented a smaller share in the total population, currently has a substantial impact in the estimates for 2022 and 2023 and will likely continue to do so in 2024 and possibly 2025.
Does this affect materially the LFS estimates of the various labour market rates — of unemployment, employment, labour force participation and monthly growth? Statistics Canada assures me it does not.
I released this paper on July 5, 2024. On September 20, 2024 Statistics Canada released a paper on the same topic making essentially the same points, but with a different focus. See: Labour Statistics: Technical Papers: "Interpreting population totals from the Labour Force Survey," Catalogue number 75-005-M2024004.
The author wishes to thank the people working on the Labour Force Survey program at Statistics Canada who answered his numerous questions with patience and care. Any errors or misunderstandings remaining in this paper are mine alone.
Among these dimensions are hours worked, earnings, industry of employment, occupation, class of worker, census metropolitan area and economic region, educational attainment, immigrant status, summer students, visible minority groups, multiple job holders, family structure, Indigenous groups, disability status, job tenure, union status, work absence and more.
I have been told this by Statistics Canada experts.
The Guide to the Labour Force Survey defines the LFS target population in these words: “The target population covered by the survey corresponds to all persons aged 15 years and over residing in the provinces of Canada, with the exception of the following: persons living on Indian reserves, full-time members of the regular Armed Forces and persons living in institutions (for example, inmates of penal institutions and patients in hospitals or nursing homes).”
See Statistics Canada tables 17-10-0121-01 and 17-10-0009-01.
The term ‘landed immigrants’ refers to persons who have applied for and been granted permanent residence status in Canada. The term is less used today than in the past and has largely been replaced by the term ‘permanent residents’. NPRs are not landed immigrants.