

Productivity performance in Canada compared to other developed countries
Productivity performance in Canada compared to other developed countries
How has Canada fared when juxtaposed with similar economies?

There seems broad agreement among economists that one of Canada’s key challenges is to strengthen productivity growth. Improvements in productivity make it possible for average living standards to rise. They help resolve social tensions by providing new resources that can be used to address problems without the need to redirect resources from elsewhere. Productivity increases are seen as unambiguously beneficial, an economic ‘dividend’ that accrues to a country that is finding better ways to do things.1 However, Canada’s productivity performance looks rather poor when lined up against those of our closest comparators.
Productivity growth means getting more output than was previously being realized from a given mix of labour, capital and material inputs. It might occur as the result of new technologies being invented and implemented in the workplace, or from existing techniques being adapted for new purposes. Changes in the way production processes are organized and managed might drive the improvements. In some instances productivity benefits come from increasing the scale of production operations, through company mergers and acquisitions2 for example. Or they could come from reducing activities in some areas of the economy where productivity is relatively low and redirecting the resources used there to other industries where productivity is higher.
Improving Canada’s productivity performance might sound easy to some ears, but governments aiming to do this have found it difficult to incentivize businesses or make it happen some other way. In our free market economy it is primarily up to businesses to find ways to improve productivity and their success in doing so has not been great overall.3
In this article I look at the available productivity statistics to see how Canada’s performance compares with those of other countries. I also drill down to examine how Canada’s productivity growth has varied across its major industries, to ferret out the strong, middling and poor performers.
Two definitions of productivity
The most common, and easiest to calculate measure of productivity is labour productivity (LP), which is real output per unit of labour services input. Output is usually defined as value added (GDP) in some part or all of the economy and labour input as total hours worked in that part of the economy. Defined this way, labour productivity can rise because of innovation or other efficiency improvements, or from greater use of capital, or from a shift in production and employment from lower to higher productivity industries.
The other measure is multifactor productivity (MFP). In addition to labour services, it takes explicit account of capital services provided by structures, machinery and equipment, and intellectual property such as software or the knowledge gained through mineral exploration. It may also take account of the energy and materials input. MFP is a broader concept and can be thought of as the ratio of real output to a weighted average of the different kinds of inputs.4 It is more challenging to measure MFP than LP because it requires assumptions about the way in which inputs are combined to produce output and because the measurement of capital services inputs is challenging.
Canada’s labour productivity performance
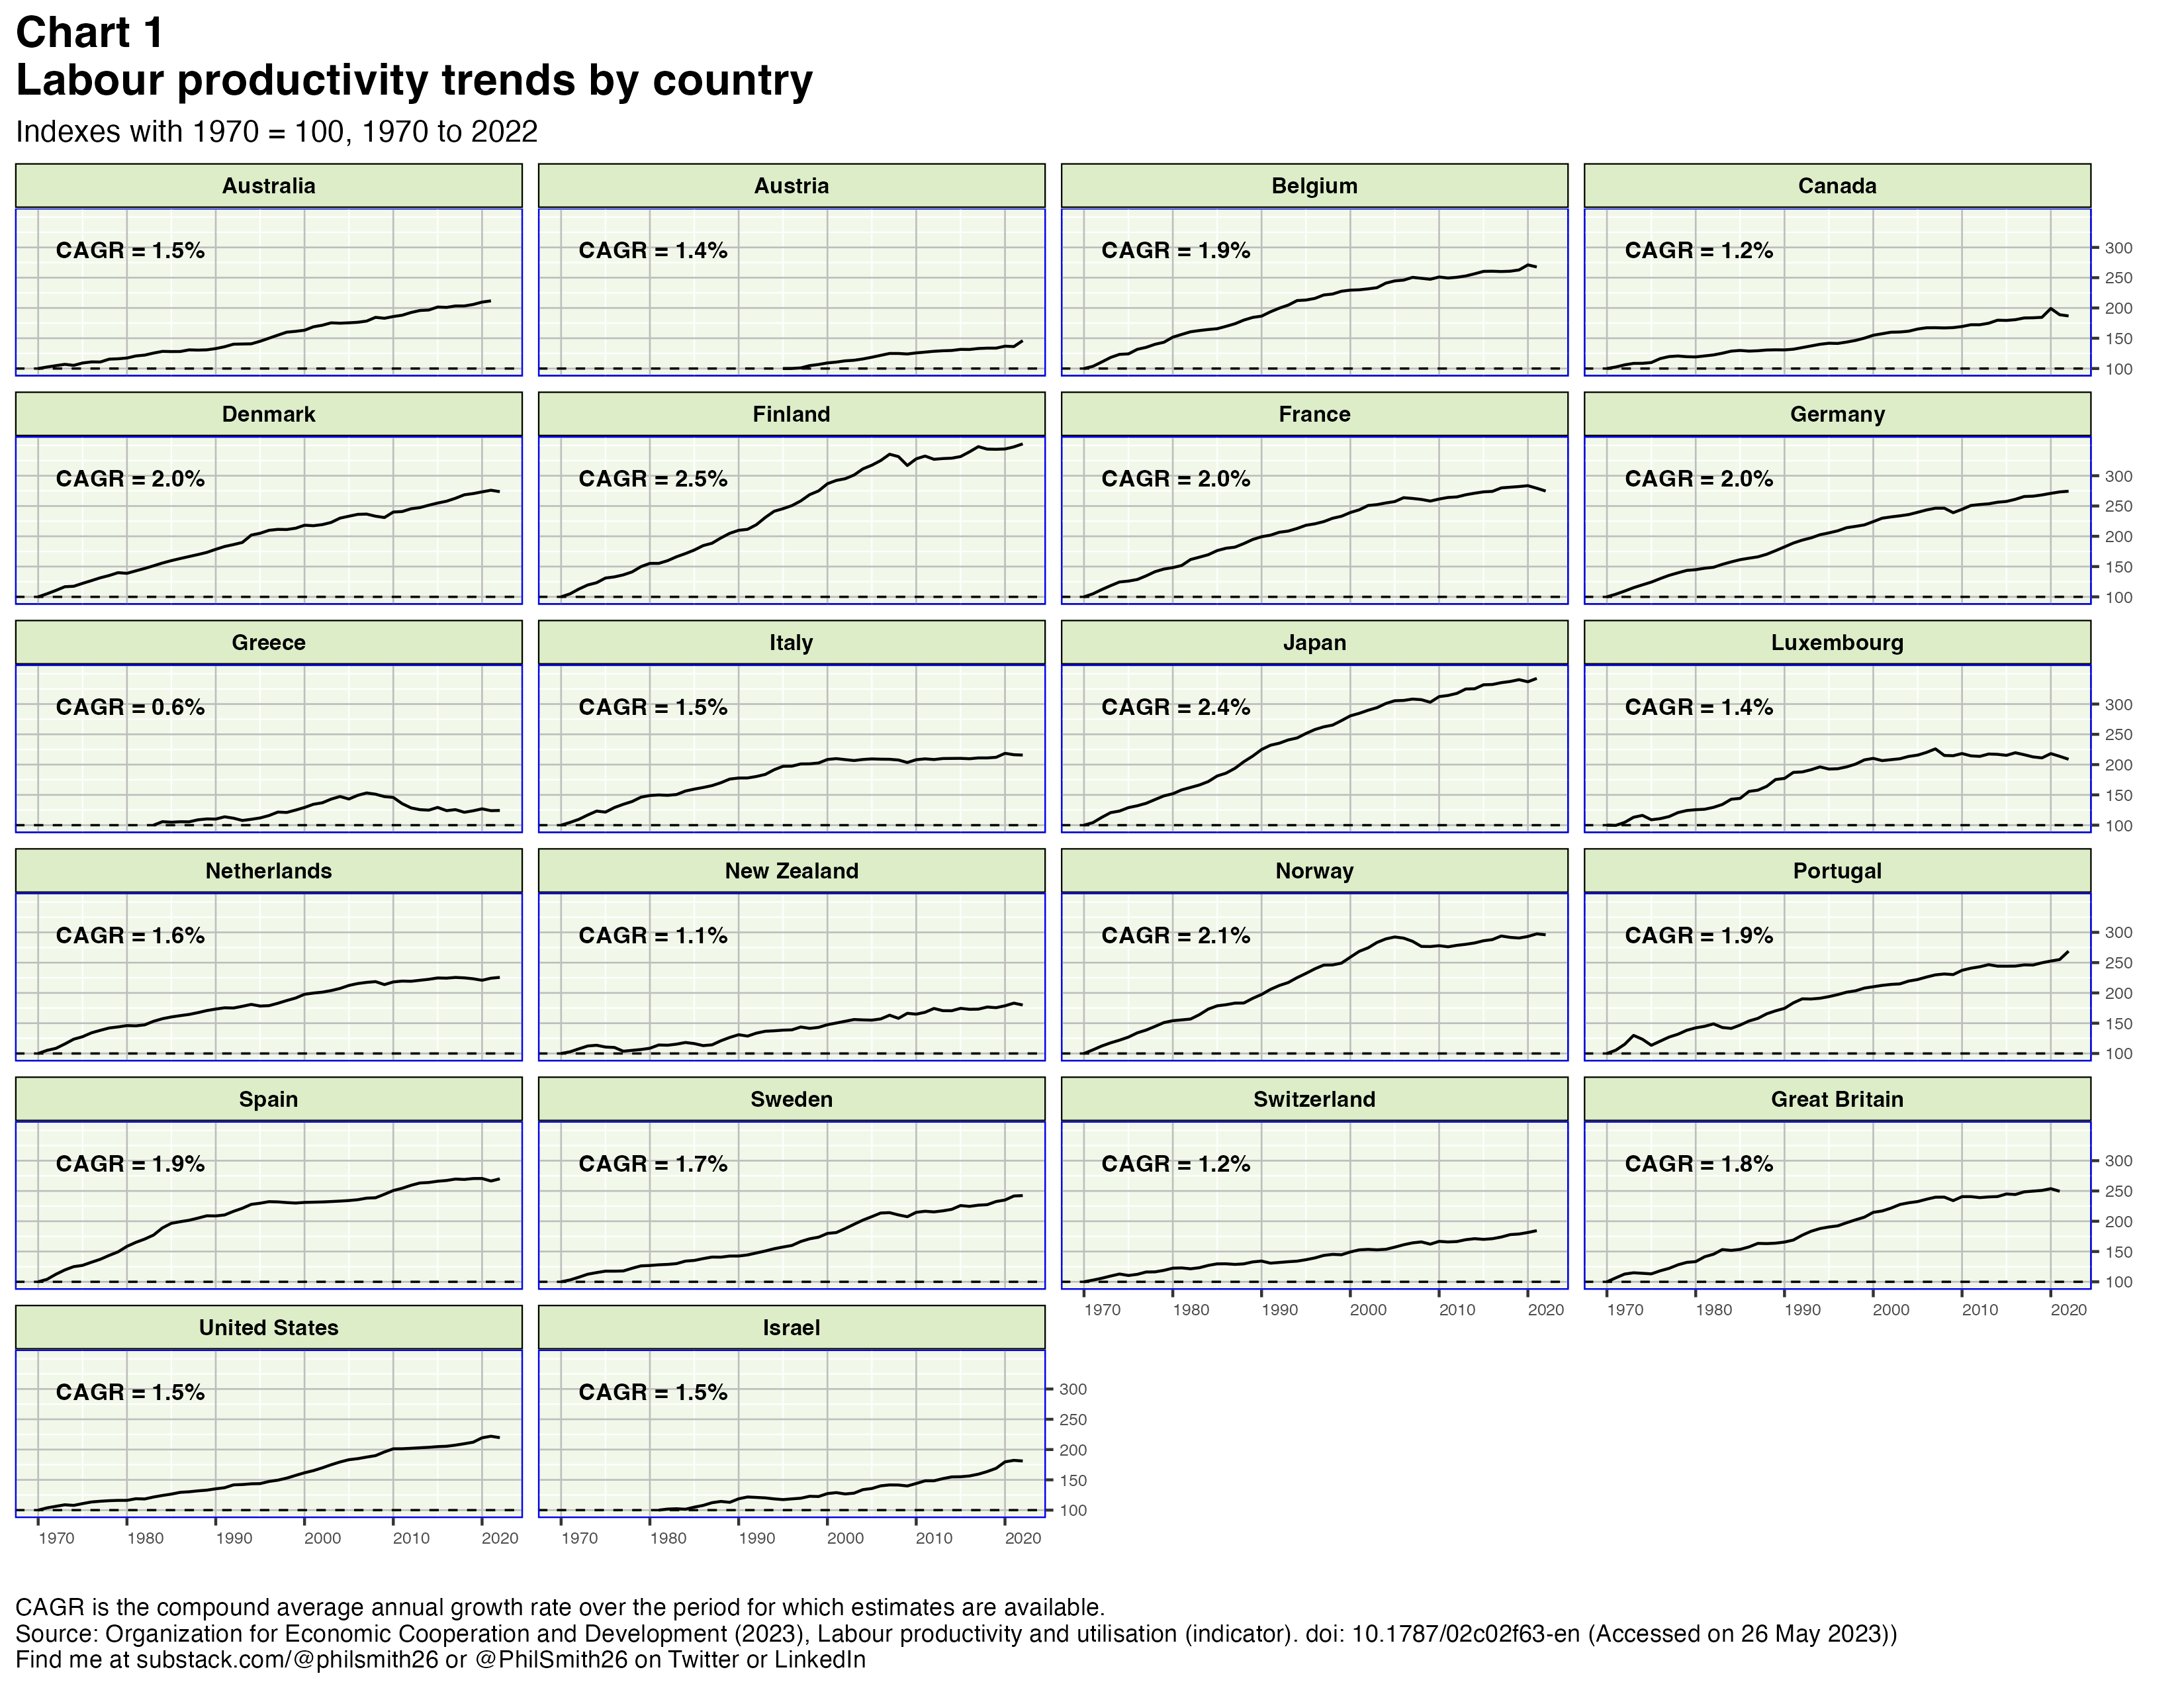
Chart 1 compares Canada’s labour productivity, as calculated by the Organization for Economic Cooperation and Development (OECD), with those of 21 other developed countries. With any productivity indicator, one can have more confidence by looking at a long-term average growth rate than by focussing on shorter periods of time which can be distorted by economic shocks, cyclical forces and statistical measurement issues. Canada’s compound average annual growth rate (CAGR) in productivity over the period for which statistics are available is the third lowest among these countries, greater only than those of Greece and New Zealand (and in New Zealand’s case by only the slightest of margins). This is the relatively poor performance that economists are expressing concern about.
Unfortunately the OECD does not provide industrial breakdowns for the labour productivity estimates in chart 1. It could be revealing to see where within the Canadian economy the productivity weakness has been the greatest. Statistics Canada does publish such a breakdown though. It is important to note that their estimates are for business sector productivity, whereas those from the OECD are for the entire economy. The reason StatCan prefers to define productivity in this more limited way is that the data for government and non-profit sector output generally assume it moves in parallel with the labour input, implying the productivity CAGR is zero.5 Some such assumption is necessary because there is no market price for government output. The market value of politicians, public administrators, the military, hospital workers, school teachers, the police and so on is unknown. This of course makes the aggregate OECD productivity growth estimates lower, although of course this is true for all countries in their data. Chart 2 shows Canada’s business sector labour productivity statistics, as estimated by StatCan, decomposed into 16 industry components.
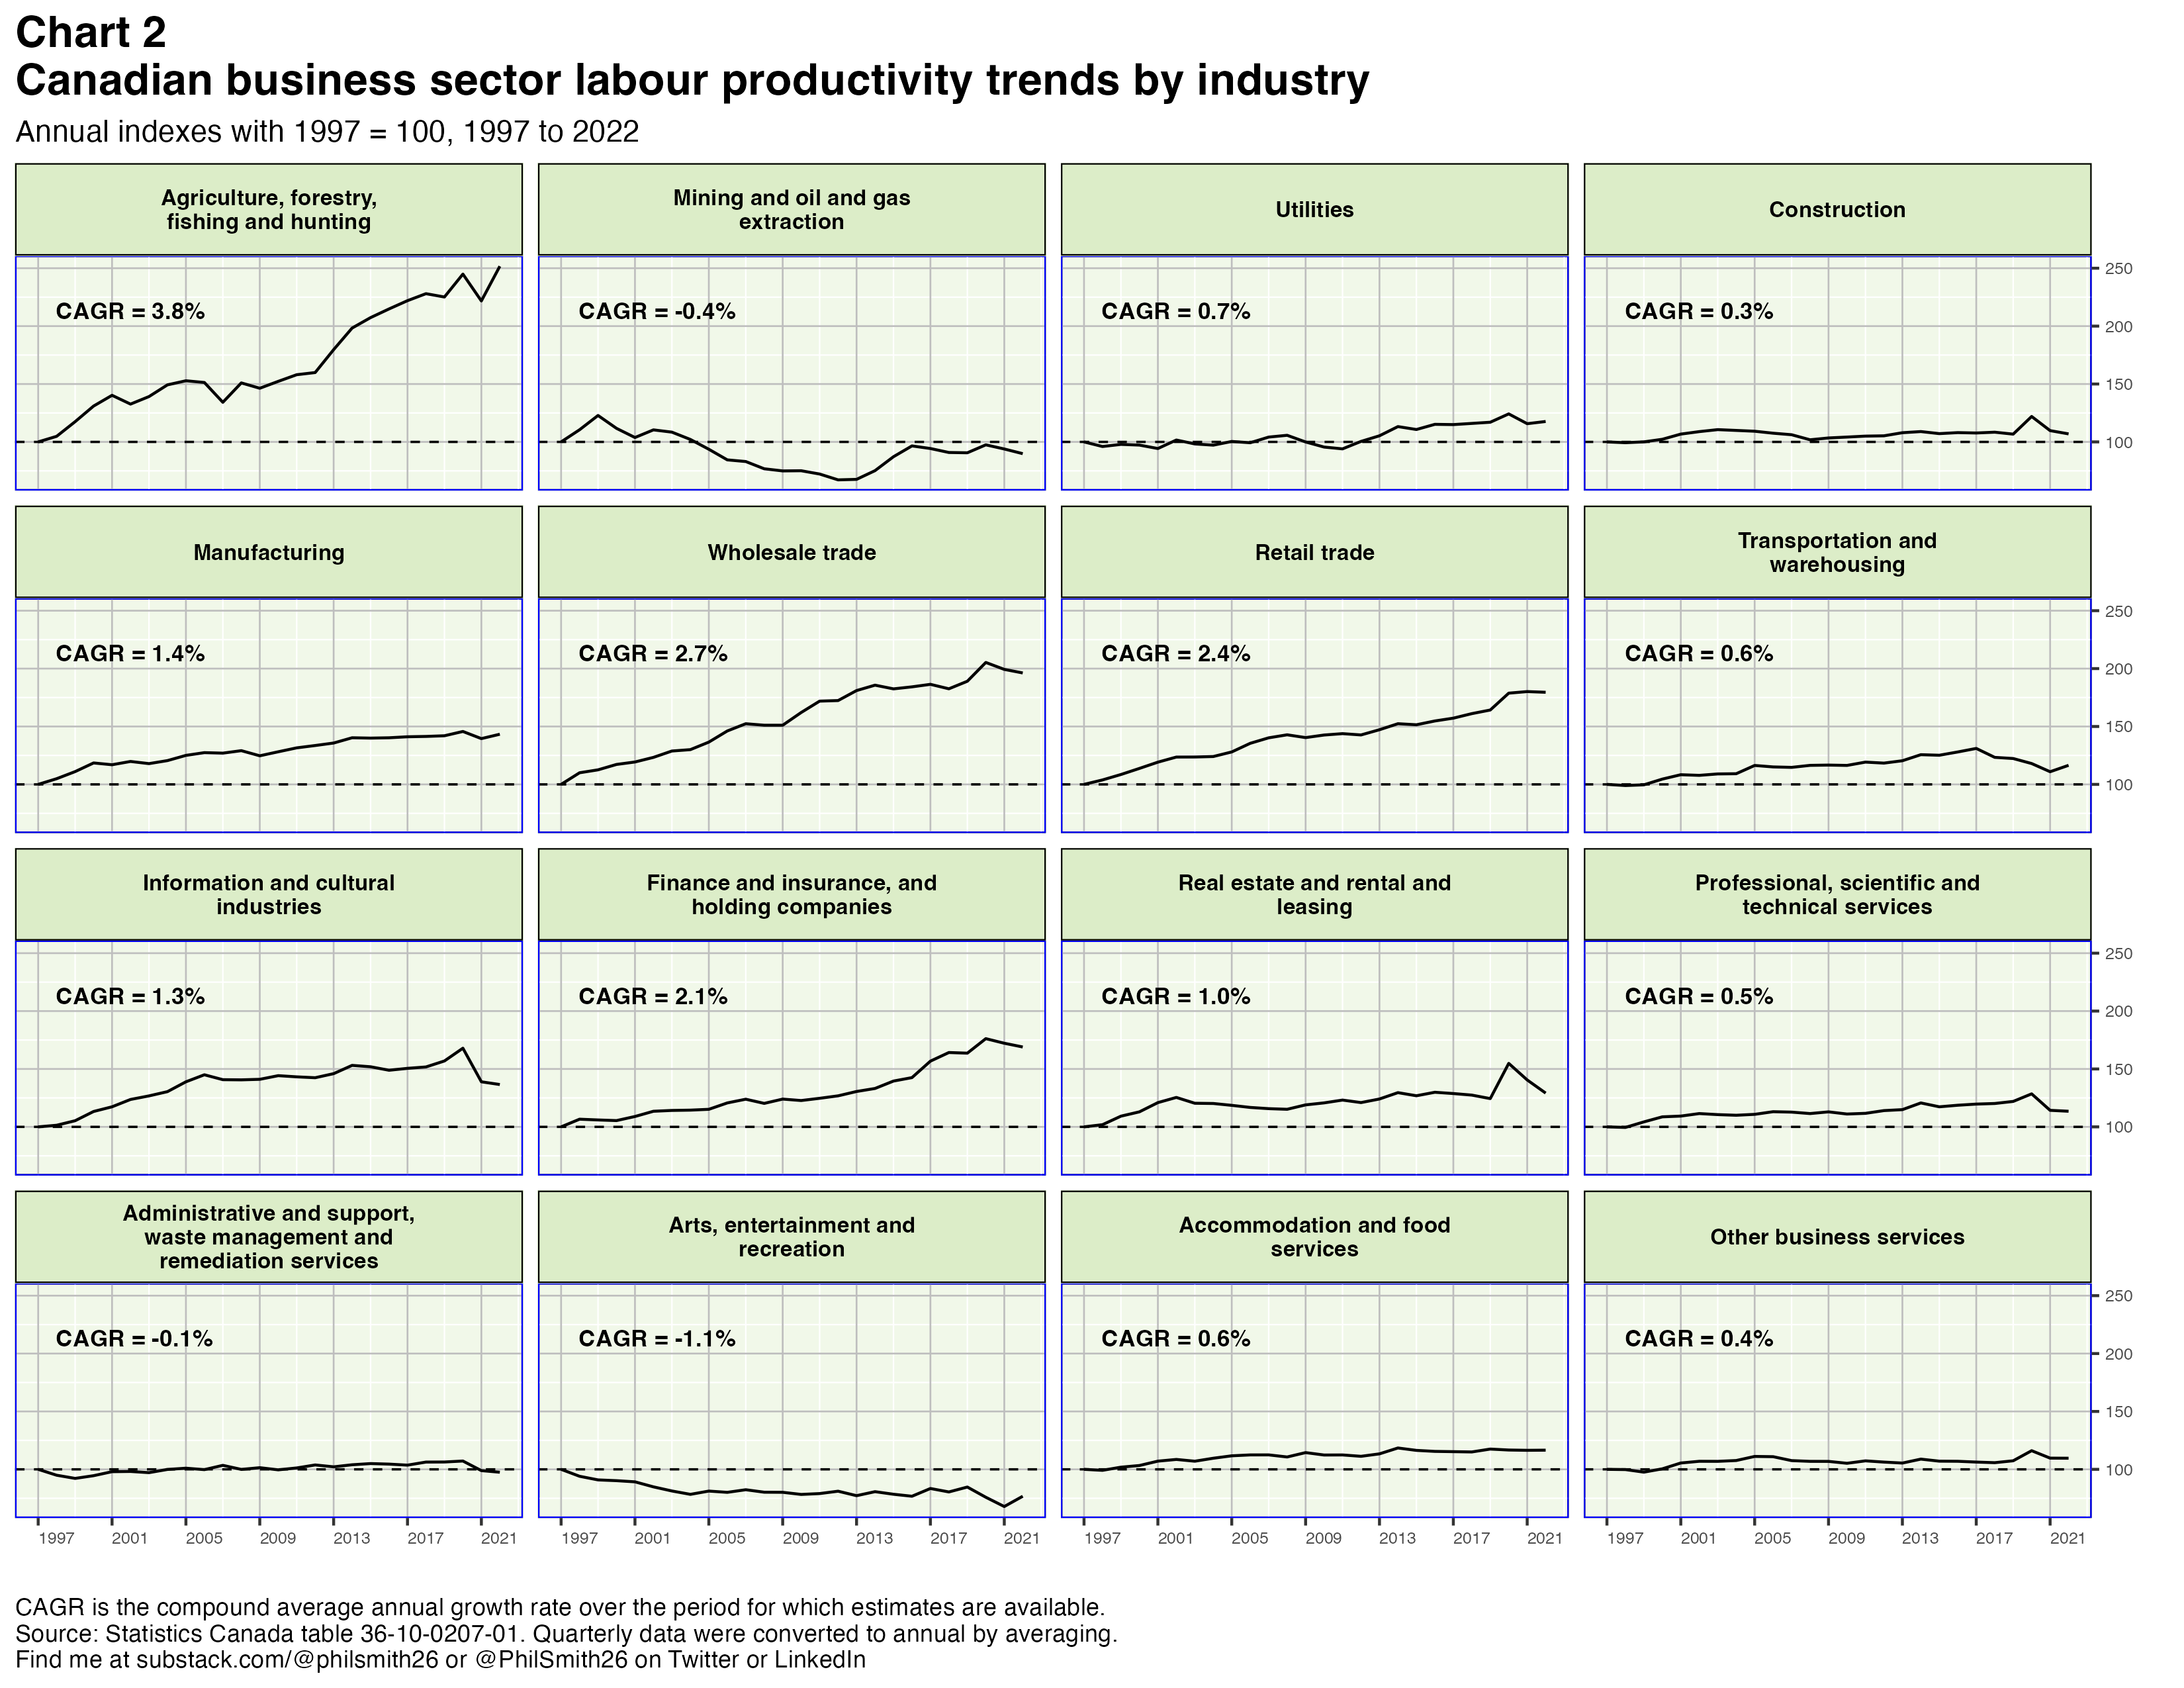
The outstanding performer is the agriculture industry. There have been so many important technological advances in this domain such as GPS-guided machinery (including drones), remote sensing and genetic modification of crops. Farmers have gained knowledge about optimal agricultural management practices as a result of research and development efforts, both privately and publicly funded. Labour productivity grew at a 3.8% annual clip between 1997 and 2022.
The next two strong performers have been wholesale and retail trade, where a variety of new technologies, many of them pioneered by US distributors, have made the distribution of goods much more efficient. These industries saw labour productivity improve at annual rates of 2.7% and 2.4%.
Finance and insurance had average annual productivity growth of 2.1% while in manufacturing the increase was 1.4% over the period. Information and cultural industries had productivity growth of 1.3% and real estate and rental and leasing had a CAGR of 1.0%. All of these industries benefitted greatly from the enormous advances in digital processing, automation and big data analysis over the last 25 years.
Areas with undistinguished trend productivity growth include utilities, transportation and warehousing, accommodation and food services, professional, scientific and technical services, other business services and construction. These might be areas where Canadian businesses have particular scope to improve productivity.
Mining productivity decreased slightly over the full period. It cycles with world commodity prices. The lack of growth relates in large part to the fact that the lowest-cost metal and mineral deposits are exploited first and as these are depleted, deposits with higher extraction costs must be turned to. Administrative and support, waste management and remediation services had very modest productivity growth up to 2020, but it fell after the pandemic and has not yet recovered.
Finally, productivity in the arts, entertainment and recreation industry dropped steadily from 1997 to 2004 and then flattened out. This is an industry in which capital accumulation, a key driver of labour productivity, has been less important. It is also one with large potential economies of scale and Canada’s limited market, compared to the US, may have been a factor in its relatively poor productivity performance.
Multifactor productivity
As mentioned earlier, the alternative to labour productivity is the multifactor productivity concept. Here is what the Organization for Economic Cooperation and Development (OECD) in Paris has to say about MFP:
“Multifactor productivity (MFP) reflects the overall efficiency with which labour and capital inputs are used together in the production process. Changes in MFP reflect the effects of changes in management practices, brand names, organizational change, general knowledge, network effects, spillovers from production factors, adjustment costs, economies of scale, the effects of imperfect competition and measurement errors. Growth in MFP is measured as a residual, i.e. that part of GDP growth that cannot be explained by changes in labour and capital inputs. In simple terms therefore, if labour and capital inputs remained unchanged between two periods, any changes in output would reflect changes in MFP.”6
The OECD provides estimates of MFP for its member countries and its findings are shown in chart 3. Again CAGRs are shown and they reveal Canada’s performance to be mediocre at best. Of the 22 countries shown in the chart, only seven had CAGRs lower than Canada’s. Two others, France and Netherlands, had the same CAGR as Canada and the other 12 countries all had stronger MFP growth. The time series patterns indicate that some 14 countries have experienced stagnant or declining productivity since around 2008, the year of the “Great Recession”, or even earlier, though Canada is not one of them.
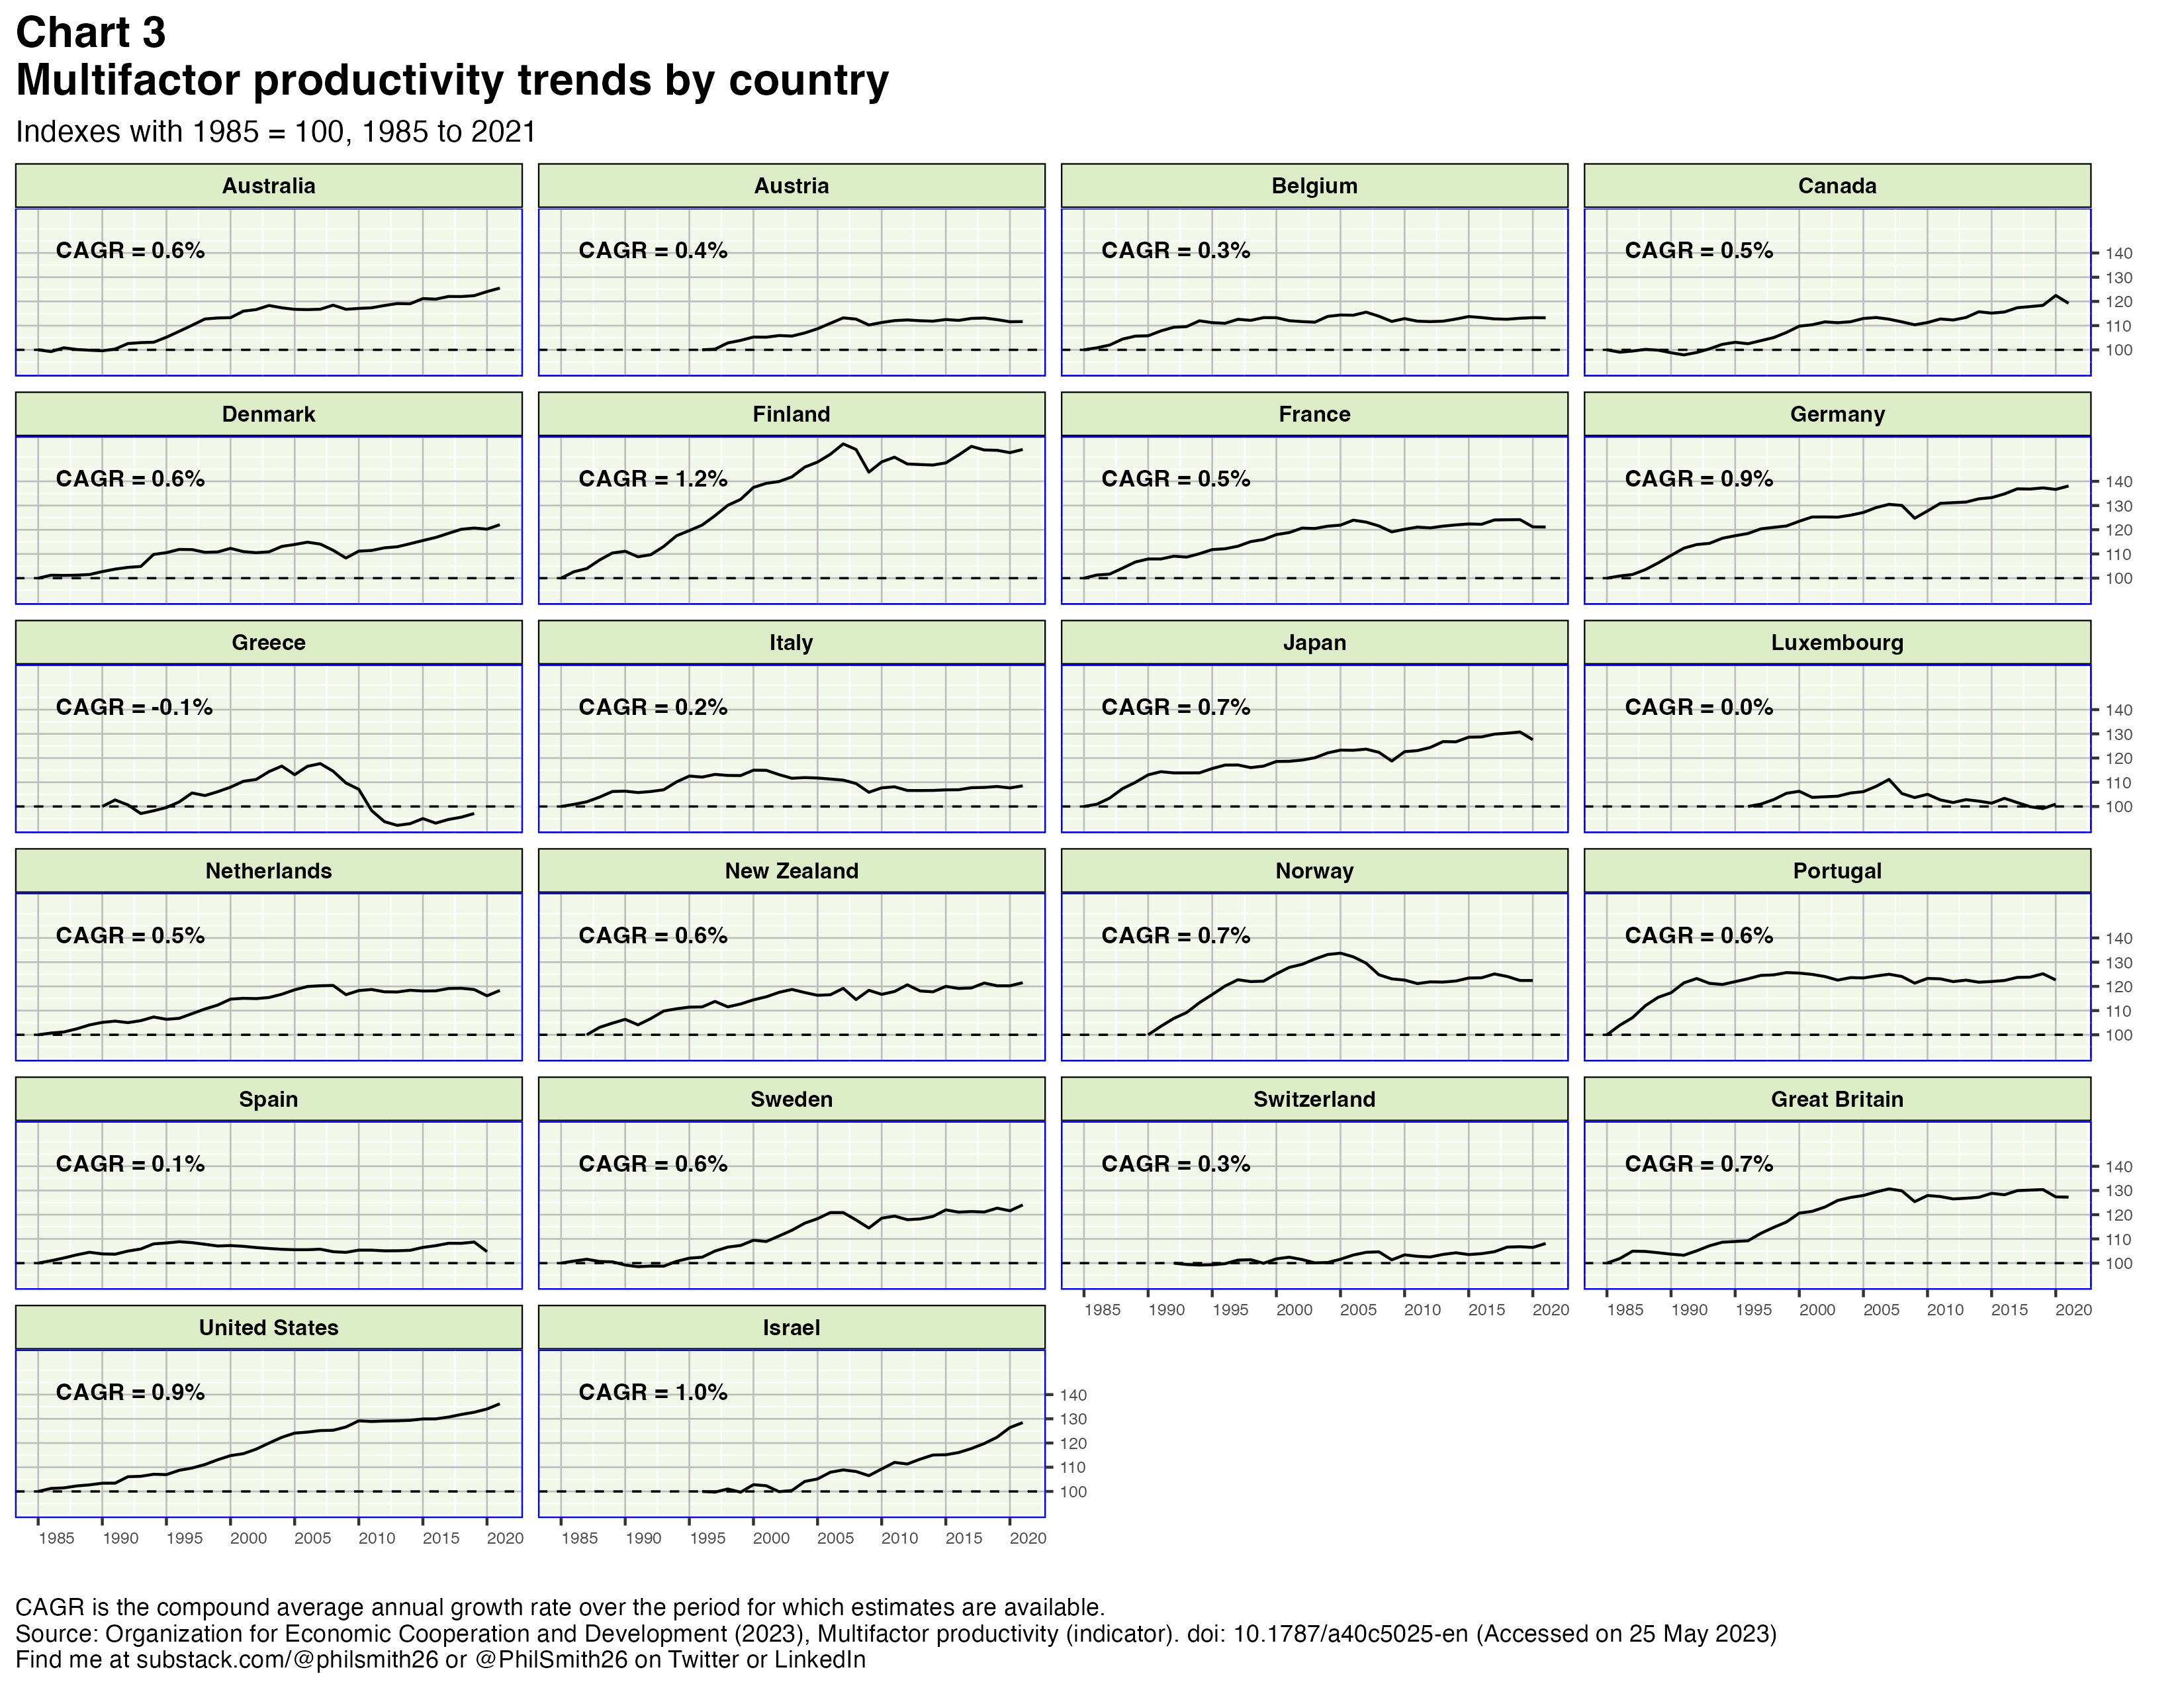
It is difficult to explain the differences in the MFP trends across countries, but there appears to be a correlation between the trend rate of real GDP growth in a country and its trend rate of MFP increase. In short, it seems economic growth is beneficial for MFP growth while economic stagnation or decline has a harmful impact on MFP. It also appears the MFP trend slowed in many countries starting around 2008, the year of the “Great Recession”.
Reasons to be sceptical about the productivity estimates
There are many reasons to be sceptical about the numbers. The productivity estimates we are dealing with are small percentages, so statistical bias errors7 with respect to the outputs and inputs that might seem minor can have major consequences. And the measurement of outputs and inputs is very difficult. With respect to labour productivity, one person’s ‘hour of work’ is not the same as another’s — for reasons of training, experience, strength, industriousness and a variety of other characteristics — so it is not so straightforward to aggregate employee hours properly. It is a common practice, though, to treat all hours worked as equivalent.8 Measuring capital services inputs is, in some ways, even more fraught with difficulty. There are ways to measure capital stocks by deflating, accumulating and depreciating investment spending, but a common way to measure the services provided by that capital is just to assume they are proportional to the stock when, in some cases, they may rather be proportional to the output. In addition, comparisons across countries can be perilous because of differences in national statistical systems, despite the existence of international standards in this domain. The size of the public sector varies among countries as well and, as noted, productivity growth in this sector is essentially zero by construction. Canada’s public sector is substantially larger, as a share of GDP, than is the case in the US and because next-to-no productivity gains are recognized in the public sector by either country, this adds a downward bias to Canada’s performance when doing a two-country comparison. Finally, when focussing on MFP, the preferred measure from a theoretical perspective, one must measure additional inputs and make assumptions about the functional form relating them to outputs. Different assumptions can yield different results.
Conclusions
Canada’s productivity performance has seemingly been very poor over the last three years.9 But this period was disrupted by the worldwide pandemic shutdowns, the unbalanced economic aftermath, supply shortages and the inflation surge. It would be hazardous to assess productivity trends based on only three years of measurements even in the best of times, but this is especially true for productivity trends in these three turbulent years.
Canada has mostly been a follower rather than a leader with productivity improvement and I do not see a problem in that. We are a small and cautious nation residing beside a big and very dynamic one. We have a less competitive culture. As America leads the world on this front in so many ways — exploiting the Internet’s potential, discovering new vaccines, adopting cheaper renewable energy-producing technologies, inventing new approaches to retailing and currently pushing forward the enormous potentiality of artificial intelligence modelling — it makes sense for us to follow behind them as best we can, learning from and adapting their successes to our circumstances. While I am, of course, not opposed to research and development spending, I do not believe there is much productivity mileage to be gained from that in Canada’s case. To me, the future can be quite good for Canada’s productivity performance if we focus more attention on adopting and exploiting, more rapidly and comprehensively than at present, the many new and better approaches to the production of goods and services our American friends are constantly developing.
We should also, perhaps, resign ourselves to the fact that our measured LP and MFP performance will always be handicapped by the important role that resource mining plays in our economy. It is very likely that mining productivity will always be a drag on our total performance. The other industry that has been a significant drag, as shown in chart 2, is arts, entertainment and recreation. Performance in this industry is limited by the small size of our Canadian market, especially in two-country comparisons with the US, and perhaps by its historical reliance on external financial support from private and public donors. Productivity, profitability and investment are tightly linked and this industry tends to lack all three.
While this is certainly true in an aggregate sense, it would not be true for each and every Canadian. Productivity gains usually benefit some and hurt others (who might lose their jobs, for instance). In principle, governments can take actions to ensure the overall benefits of national productivity gains are distributed more evenly, but how much this actually happens is open to question.
A great exemplar of Canadian productivity growth is seen in the Constellation Software company. Founded 28 years ago with an initial capital of $25 million, it has grown steadily to become a $56 billion corporation via a strategy of software acquisition, development and improvement to address the specific needs of many different industries. Someone who invested $100 in 2006 when the company went public could sell his investment for $10,750 today. It is perhaps the most successful Canadian public company of the modern era.
Those wanting to blame Canadian governments for the country’s poor productivity performance say that taxes are too high and the web of regulations is overly burdensome. While it might be true that significant tax reductions and reduced regulation would incentivize increased business productivity, taxes and regulations exist to provide other advantages to Canadians, so it is unclear that action along these lines would be of net benefit.
It is really more complicated than just calculating a weighted average. Measurement of MFP requires an assumption about the economy’s production function, which is the mathematical relationship between amounts of labour, capital and material inputs and the resulting output. Different assumptions about this relationship imply different degrees of substitutability between the kinds of inputs and the extent to which increasing the scale of production with a proportionally greater set of inputs yields proportionally higher or lower returns. MFP appears in this framework as shifts in one or more parameters in the mathematical relationship.
This is a conservative assumption. Presumably government sector labour productivity has benefitted from many of the same forces that have affected the private sector — capital accumulation, innovation, new technologies, economies of scale and so on — even if, in the absence of the profit motive, the productivity benefits may have been less in the public sector.
Organization for Economic Cooperation and Development (2023), Multifactor productivity (indicator). doi: 10.1787/a40c5025-en (Accessed on 25 May 2023).
Almost all statistics are subject to error, but one hopes the error is equally likely to be on either side of the true value. A statistical bias exists when it is more likely to be on one side than the other.
Alternatively it could be assumed that the proportional mix of the labour input in terms of quality remains unchanged.
When the pandemic struck in early 2020, Canadian governments took aggressive actions to restrict economic activity in order to limit spread of the COVID-19 virus. Businesses laid off workers, while ‘hoarding’ their most experienced and hard-to-replace employees to keep their businesses operational. The immediate impact was to boost their measured labour productivity considerably, given that all hours worked are treated as equivalent in the calculation whereas in fact businesses were typically letting go their least productive employees. Then, vaccines were invented quite quickly and the restrictions on economic activity began gradually to be lifted as 2021 began. Rehiring began and the measured boost to productivity in 2020 was soon erased. In comparisons with the US it is important to note that the shutdowns to limit spread of the virus were more widespread and of longer duration in Canada. As a result, on the one hand, deaths per capita were three times higher in the US than in Canada, but on the other this had real economic costs for us. Coming out from the pandemic, the US economy resumed labour productivity growth along its pre-pandemic trend line while in Canada there has been essentially no productivity growth since the pandemic began.