

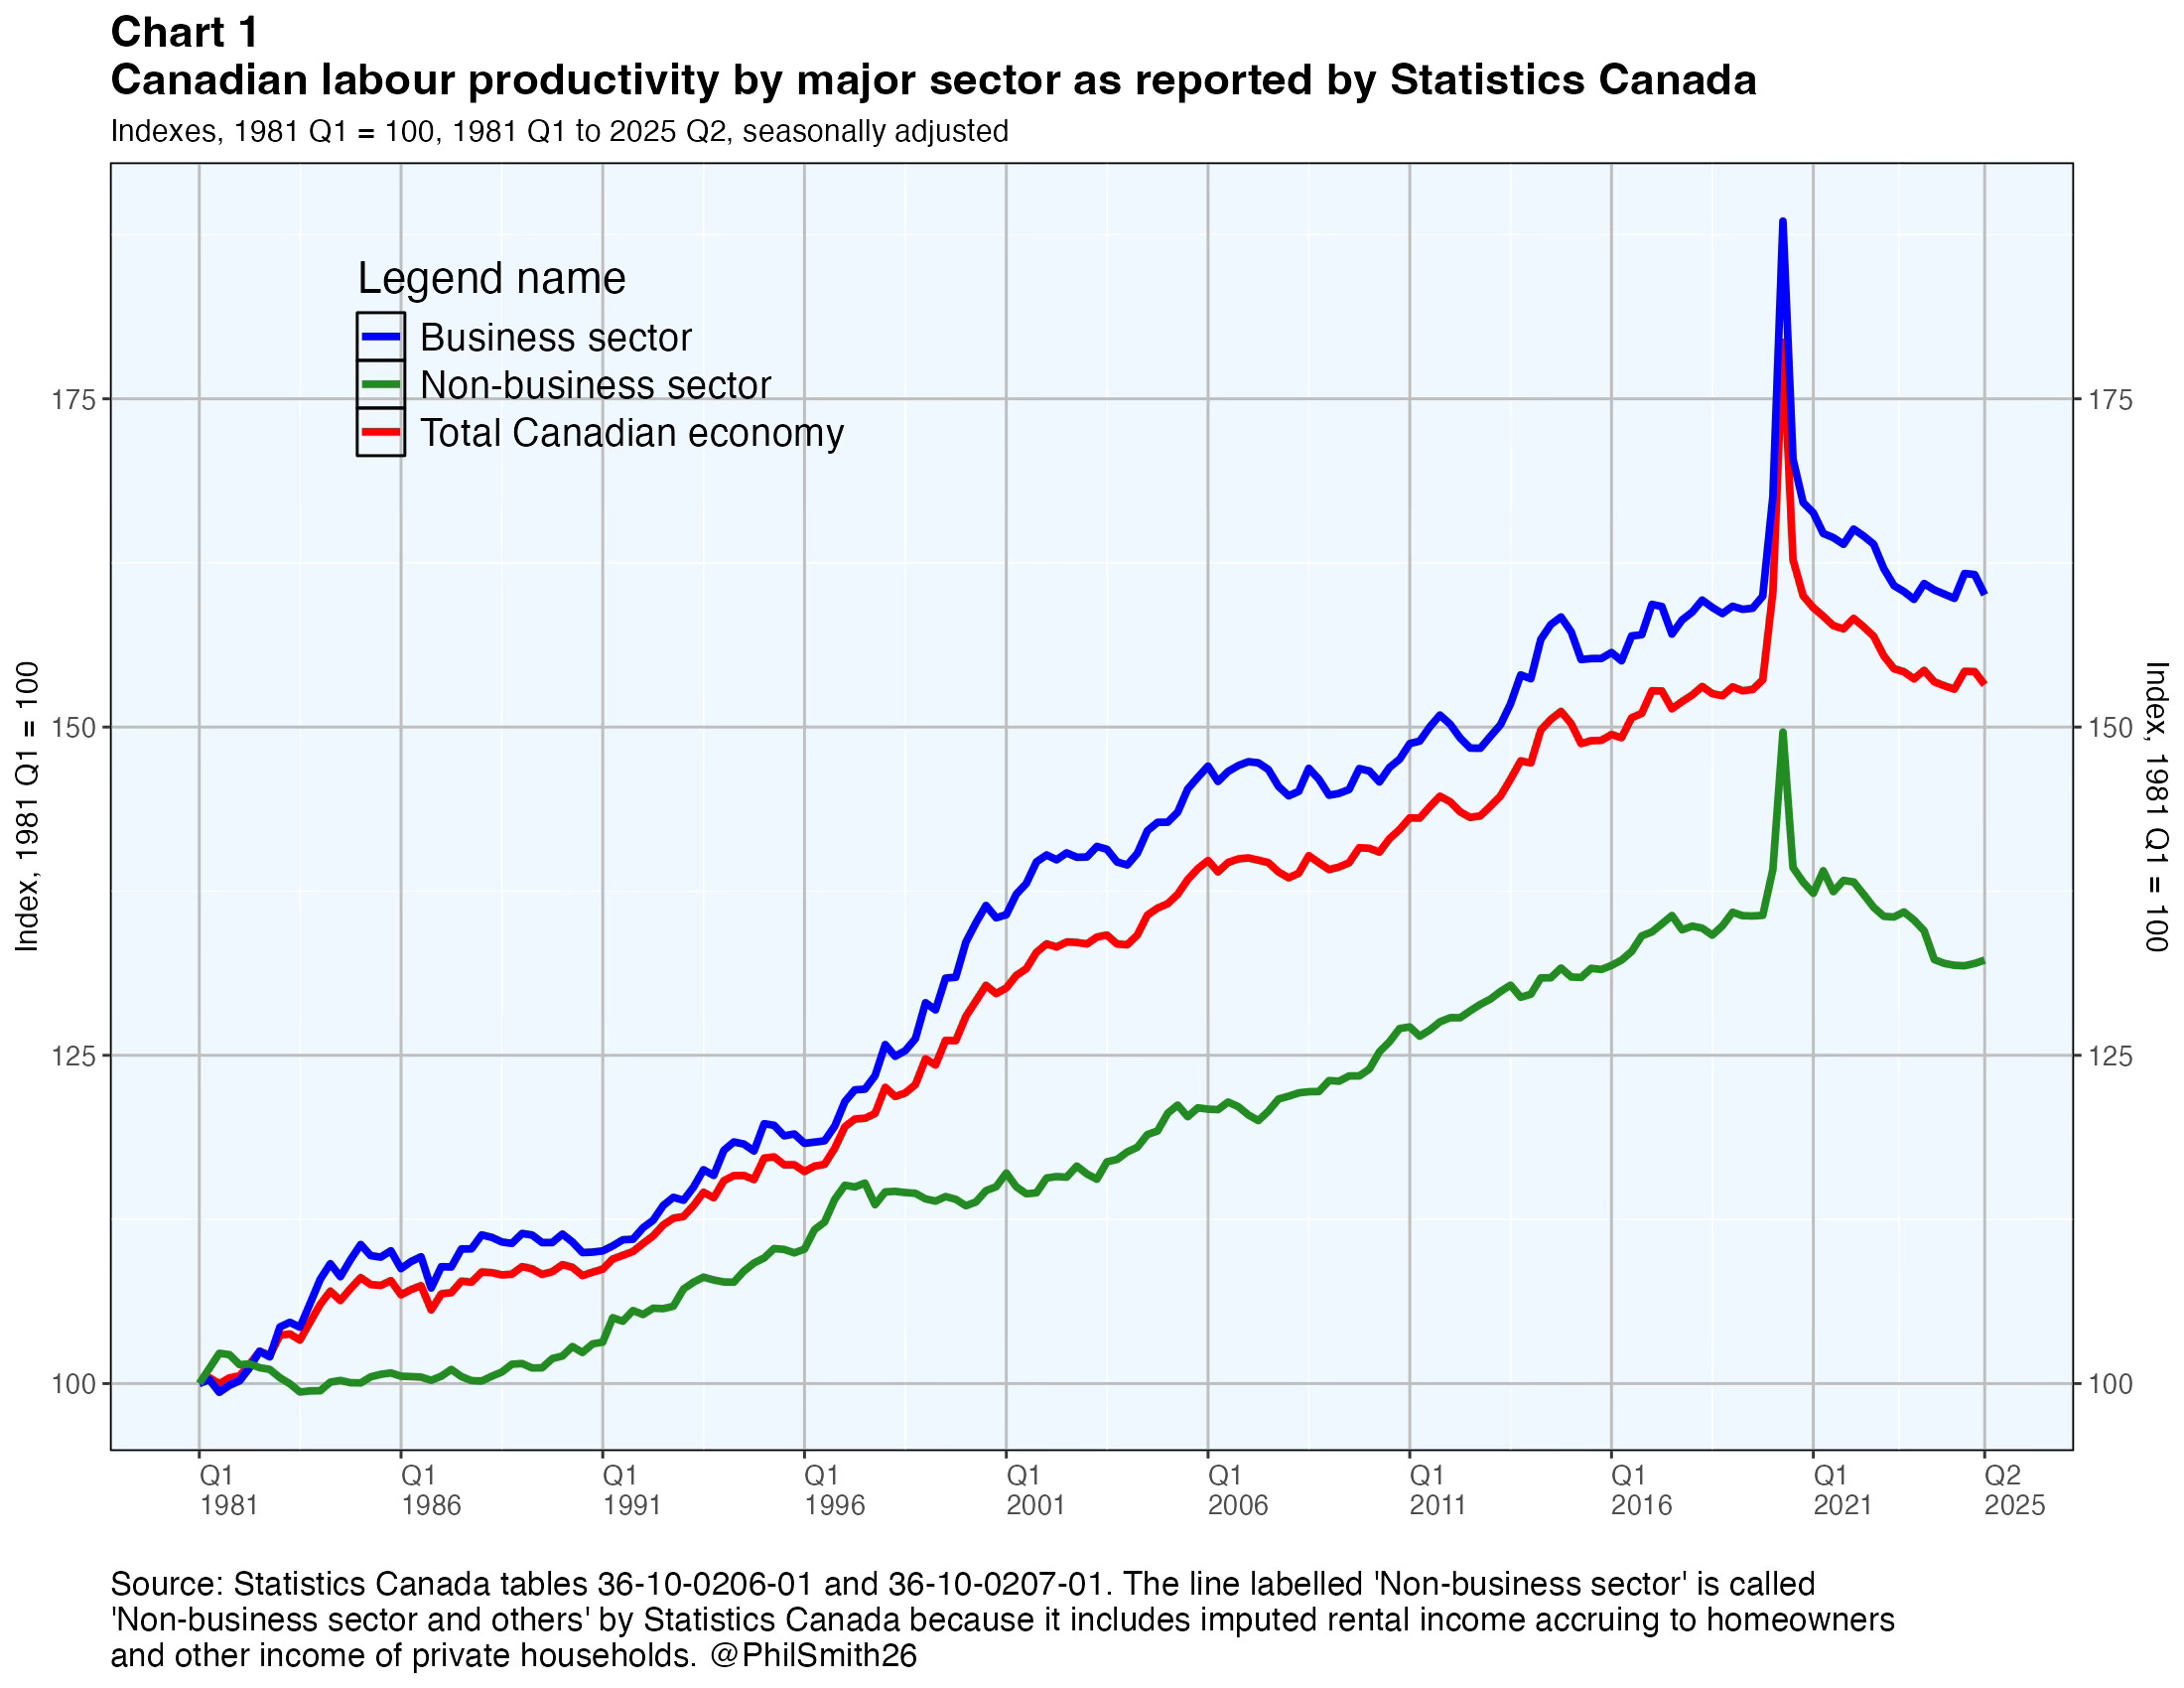
There appears to be near-unanimity among Canadian economists that the country’s major economic problem today, aside from US tariffs, is the lack of significant productivity growth. This problem is evident in the Statistics Canada time series for labour productivity depicted in Chart 1.1 Over the full 44-year period, Canadian productivity rose at a 1.0% compound average annual rate with business sector productivity increasing 1.1% and productivity in the non-business sector2 growing just 0.6%. But in the more recent period between 2019 Q4 (the last pre-pandemic quarter) and 2025 Q2 total productivity growth was 0.0%, business sector productivity 0.0% and non-business sector productivity -0.5%.3
These statistics indicate that both the business and the non-business sectors have contributed to the recent productivity problem. However, this paper argues we really have no true understanding of what has happened to non-business sector aggregate productivity, either recently or over the full 44-year period. Statistics Canada’s productivity time series for the non-business sector is quite misleading. True productivity change in the non-business sector could actually be trending down or, which seems more likely to me, rising more rapidly than Statistics Canada reports.
The basic argument
We measure real business sector gross output by calculating its market value and dividing by an appropriate price index. Since we know the value and price of the output, we can estimate fairly accurately an index of real gross output through time. Dividing that real output time series by a measure of real input, either a comprehensive one encompassing all inputs or a simpler proxy such as a count of labour hours worked, yields a good indicator of productivity change.
For an individual firm that would mean keeping track of the sales values and quality-adjusted prices of each of its products over time and using these data to calculate an aggregate firm real output index. A real input index could be calculated in a similar fashion, keeping track of the value of the individual inputs (including various types of labour) and the prices paid for those inputs. The firm’s productivity index could then be calculated by dividing the former by the latter.
For net output (value-added), as calculated in Statistics Canada’s supply and use tables, real output is, in principle, calculated by double deflation. In other words, real value added is the deflated sum of gross outputs minus the deflated sum of inputs. Productivity is then calculated by dividing real value added by an aggregate measure of real inputs. Statistics Canada’s labour productivity statistics are calculated from the real value added measure of output.
But in government4 there is no market value for output, except in a few minor instances,5 and there are essentially no prices for government output. There is only the cost of producing the output. This is true for policing, defence, most health care, elementary and high school education, the legislature, the administration of justice, tax collection, regulatory agencies, national statistics and many other types of government output. Such output is not sold in the market, so we do not know how it is valued by those who consume it. We only know what it costs. If we define the output by the costs and the input by those same costs, then of course productivity will never change. If we define the cost-based output using a different collection of cost items in the numerator than in the denominator, then productivity will appear to change, but that change will not be meaningful.
One might say that in a democracy, the value of aggregate government output is assessed by the voters. But that does not get us very far in calculating a quarterly output time series. In rare cases, the public may attribute little or no value to some types of government output. The proverbial “paying workers to dig ditches and then fill them in again” (a possible job creation initiative) might be a good example. In the business world, if the public attributes near-zero value to a product, that item will not be produced for long because doing so implies financial losses. In the government, while we also want valueless outputs to be prominently flagged there are few if any market tests to signal this.
But government does produce lots of extremely valuable outputs. Without policing, childhood education, health care, justice administration and the like our society would fall apart. The proof of their value is that the public is always demanding more of these services, though of course they do not usually demand higher taxes to pay for them. This is the valuation problem. Most public goods and services are unquestionably valuable, but their precise value is hard to estimate.
Government production processes for public goods and services, and most government outputs are services rather than goods, have undoubtedly become a lot more efficient through time. Government production takes advantage of the same innovations that have been exploited by business - the use of electricity when it became available in the second half of the 17th century, air travel when it arrived in the 1920s, digital technologies that began to emerge after the second world war and most recently artificial intelligence among many others. The problem is neither that the government produces nothing of value nor that it never becomes more efficient in its production processes. It is, rather, the inherent difficulty, one might say near-impossibility, of measuring value when there is no market test.
This has always posed a dilemma for national accountants. We want GDP to include government outputs, as well as business ones, because they are unquestionably valuable and indeed account for roughly a fifth of the nation’s labour resource utilization. But unlike the business part of national output, the government part has no explicit market value. So proxies must be chosen. Accordingly, for nominal GDP government outputs are valued at cost. Though we have no way of knowing for sure, this is probably quite conservative since business outputs, the comparator, are usually valued above cost in the marketplace. The difference in the business case, of course, is profits. For real GDP, as mentioned previously, business output is calculated by dividing output at current prices by an index of market prices. But this cannot be done for government outputs since we have neither a true nominal value of government outputs nor a corresponding market price.
Most statisticians around the world, including those in Canada, use the rate of change in hours worked by government workers as the main proxy for the rate of change of non-market output when they are calculating real GDP. Measures of real government capital depreciation and intermediate inputs can also be used. But if we take real government output as measured in the national accounts and divide by hours worked in government, yes, there will appear to be relatively little or no improvement in productivity. That’s because the numerator is not very different from the denominator. The numerator is inevitably a very poor proxy for real output.
Government output estimates based on activity
or outcome measures
We can, perhaps, measure output fairly well for selected government products. Take the passport, for example. It is an essentially homogenous product so we can compare the number of passports produced to the cost of producing them and how it changes over time. The quality of the passport itself and the services involved in its delivery should also be taken into account. Other output proxies can be defined for other parts of government: the number of heart surgeries in a hospital, the number of children educated in a school, the number of bills passed by a legislature, the number of data releases by Statistics Canada and so on.6 If this could be done reasonably well for a large number of carefully-chosen and representative government-produced goods and services, then the activity proxies could be weighted by costs and aggregated to obtain estimates of higher-level or conceivably even total government real output. This might be an improvement over current practises, but in the absence of market prices we would still not know what the government output is really worth.
This activity-based approach is the preferred one in the 2008 System of National Accounts (see Annex 1), but it is impractical in many instances. In the UK, for example, this method is adopted selectively, but for most parts of government output is assumed equal to inputs. In the United States, government outputs are treated as equal to government inputs and productivity change is therefore always zero. Statistics Canada does not make significant use of direct, cost-weighted activity or outcome volume measures either, to my knowledge.7
Statistics Canada’s published productivity statistics
StatCan’s official labour productivity statistics are shown in Chart 1. In my opinion, this way of portraying Canadian productivity is not appropriate. In the chart it appears both the business and the non-business sectors contribute to total productivity growth, although the non-business sector contributes less than the business sector. But their measure of non-business sector productivity is not to be believed.8
Why do they do this? I do not know, but I speculate it reflects a desire to provide users not just with a business sector productivity measure, but also with a total economy measure. I imagine them thinking: “Output and input measures are available in the national accounts for the non-business sector, so why not divide the one by the other and include it as another productivity measure?” But these measures are included in the national accounts, as recommended in SNA 2008, because the non-business sector is large and significant. They must be included in GDP even at the cost of using weak proxies. But this does not imply they should be used to calculate productivity measures.
It is notable that Statistics Canada’s multi-factor productivity estimates9 do not include estimates for the non-business sector. I speculate the reason is that they are produced by a different unit in the organization and the inconsistency has never been resolved.
Finally, one might ask why non-business sector productivity trends up in Chart 1, rather than being a flat line showing zero productivity growth. The reason is that the numerator of the calculation, real output, is derived as a sum of deflated inputs (wages, capital depreciation and possibly some intermediate inputs) while the denominator is simply total labour hours worked (that is, it excludes non-labour inputs). In addition, the deflated wage measure in the numerator might not be calculated such that it is the same as the measure of hours worked in the denominator. In the United States the Bureau of Labor Statistics takes a similar approach to Statistics Canada’s.
Consequences
As noted at the beginning of this paper, Canada’s weak productivity performance is a major cause of concern these days. Reliable statistical information is required both to diagnose and analyze the problem and to monitor progress in addressing it.
The problem is that we do not have reliable measures of non-business sector productivity. There might be a problem of slow productivity growth in that sector, but our statistics do not really let us assess this. Efforts should certainly be made to improve productivity in the sector and this appears to be an important priority for the federal government at the present juncture. It may even be possible to judge their success partially by looking closely at a few specific areas of activity, but Statistics Canada’s aggregate statistics for the sector will tell us nothing useful about that success or lack thereof.
This problem is well illustrated in a recent MacDonald-Laurier publication written by Stephen Tapp.10 From the same basic data sources referred to in this paper, he creates a “Government Productivity Index” described this way: “"It is a composite indicator that combines two key measures of labour productivity – real output per hour worked and real output per worker – each weighted equally and expressed as a ratio of the equivalent measure in the business sector. A GPI above 100, therefore, means the government sector is more productive than the business sector while a reading below 100 means that the government is less productive.” His conclusion, in the Executive Summary, is that “Once more productive than private industry, the government sector is stuck in a multi-decade productivity malaise, averaging just 0.2 per cent annual growth, well below the business sector’s 1.1 per cent annual labour productivity growth.” He draws this conclusion, quite reasonably, from the official statistics published by Statistics Canada. But as I have argued here, these statistics are fatally flawed.
Conclusions
I believe Statistics Canada should stop publishing statistics for productivity in the non-business sector. There are huge conceptual issues in the measurement of productivity when output is not valued at market prices. The relatively new SNA 2008 approach to the problem involving the use of many activity or outcome indicators for different government goods and services, weighted together using cost data, may have some potential but is still at an early stage of development. In any case, Statistics Canada does not use this approach and the estimates it does publish are simply not meaningful.
Annex 1
SNA 2008 on measuring non-market output
15.11611 The current value of the output of non-market goods and services produced by government units or NPISHs is estimated on the basis of the sum of costs incurred in their production, as explained in chapter 6. This output consists of individual goods and services delivered to households and collective services provided to the community as a whole. The fact that such output is valued on the basis of the value of inputs needed to produce them does not mean that it cannot be distinguished from the inputs used to produce it. In particular, the change in the volume of output can be different from the change in the volume of inputs. Changes in productivity may occur in all fields of production, including the production of non-market services.
15.117 In practice, there are three possible methods of compiling volume estimates of the output of non-market goods and services. The first is to derive a pseudo output price index such that when it is compared to the aggregate input price index the difference reflects the productivity growth thought to be occurring in the production process. Pseudo output price indices can be derived in various ways, such as by adjusting the input price index according to the observed productivity growth of a related production process or by basing the growth of the pseudo output price index on the observed output price indices of similar products. However, such data are rarely available for the goods and services produced by government and NPISHs.
15.118 The second approach, the “output volume method,” is recommended for individual services, in particular, health and education. It is based on the calculation of a volume indicator of output using adequately weighted measures of output of the various categories of non-market goods and services produced. These measures of output should fully reflect changes in both quantity and quality.
15.119 The third approach, called the “input method”, may be used for collective services such as defence for which the “output volume method” is hardly applicable because there are, in general, no adequate quality-adjusted quantity measures of output. The “input method” consists of measuring changes in output by changes in the weighted sum of volume measures of all the inputs. The latter should fully reflect both changes in quantity and quality. They are generally best derived by deflating the various input costs by corresponding constant-quality price indices, or when such price indices are unavailable, using volume indicators that reflect input volume change (for example, number of hours worked by employees).
15.120 It is useful at this stage to define the terms input, activity, output and outcome. Taking health services as an example, input is defined as the labour input of medical and non-medical staff, the drugs, the electricity and other inputs purchased and the consumption of fixed capital of the equipment and buildings used. These resources are used in the activity of primary care and in hospital activities, such as a general practitioner making an examination, the carrying out of a heart operation and other activities designed to benefit the individual patient. The benefits to the patient constitute the output associated with these input activities. Finally there is the health outcome, which may depend on a number of factors apart from the output of health care, such as whether or not the person gives up smoking.
15.121 The measurement of the volume of output of non-market individual services should avoid two pitfalls. The first of these is that it should not be restricted to reflect the inputs or the activity of the unit producing the services. Inputs are not an appropriate measure and while activities may be the only available indicator and hence have to be used, they too are an intermediate variable. What should be measured is the service rendered to the customer. The second risk is that if outcome is defined in terms of the welfare objectives of the non-market service (for example, changes in the quality of health for the measurement of the health service, or changes in the quality of education for the measurement of the education service) the change in the volume of the output of the non-market unit cannot be reflected by the Price and volume measures change in the indicators of outcome. This is because indicators of outcome can be affected by other aspects that are not directly related to the activity of the non-market services. For example, in the case of health, it is well-known that there are many factors other than the output of the non-market health units, such as sanitation, housing, nutrition, education, consumption of tobacco, alcohol and drugs, pollution, whose collective impact on the health of the community may be far greater than that of the provision of health services. Similarly, the output of education services is quite different from the level of knowledge or skills possessed by members of the community. Education services consist principally of teaching provided by schools, colleges, universities to the pupils and students who consume such services. The level of knowledge or skills in the community depends in addition on other factors, such as the amount of study or effort made by consumers of education services and their attitudes and motivation.
15.122 In the light of these observations, the “output volume method” is the recommended method for compiling indicators of volume change of non-market services. The method is based on quantity indicators, adequately quality-adjusted, weighted together using average cost weights. Two criteria should be respected to compile adequate indicators of volume change. In the first place, the quantities and costs used should reflect the full range of services for the functional area under review and cost weights should be updated regularly. If part of the costs of the functional area is not covered by the quantity indicator, it should not be assumed that the uncovered part follows the changes of the part that is covered. If no direct output volume method is applicable for this part, an input method should be used for it. Secondly, quantity indicators should be adjusted for quality change. For example, services should be sufficiently differentiated with the aim of arriving at categories that can be regarded as homogeneous. An aspect of quality change is then captured by changes in the proportions of different categories if the weights assigned to each category are frequently updated. In addition, the quantity indicator of each category can be augmented by an explicit quality adjustment factor. One way of identifying explicit quality adjustment factors is by reviewing the effects that the service has on measures of outcome.
15.123 It is recommended these volume indicators be tested for a substantial period of time with the aid of experts in the domain prior to their incorporation in the national accounts. Expert advice is particularly relevant in the areas of health and education, which usually dominate the provision of individual services. Further, the consequences of the estimates including the implications for productivity measures should be fully assessed before adoption. Unless and until the results of such investigations are satisfactory, it might be advisable to use the second best method, the “input method”.
15.124 Measuring changes in the volume of collective services is generally more difficult than measuring the volume changes in individual services because the former are hard to define and to observe. One reason is that many collective services are preventative in nature, protecting households or other institutional units from acts of violence including acts of war, or protecting them from other hazards, such as road accidents, pollution, fire, theft or avoidable diseases are concepts that are difficult to translate into quantitative measures. This is an area in which further research is needed.
15.125 When it is not possible to avoid using an input measure as a proxy for an output measure, the input measure should be a comprehensive one, it should not be confined to labour inputs but cover all inputs. In addition, explanatory information should accompany the national estimates that draw users’ attention to the methods of measurement.
Statistics Canada scales their productivity indexes so they equal 100 in 2017. I have rescaled them to equal 100 at the start of the time series, 1981 Q1, to illustrate more clearly how much the business and non-business sectors diverge.
Statistics Canada refers to this sector as the “non-business sector and others”, rather than just the “non-business sector” because it includes not just governments and non-profit institutions serving households, but also imputed rental income accruing to homeowners and other income of private households. In this paper I refer to it simply as the “non-business sector”.
The non-business sector accounts for about a fifth of the economy.
The non-business sector includes private non-profit organizations as well as government ones. But the government portion is far bigger and the non-profits will not be discussed explicitly here. Nevertheless it should be noted that the difficulties involved in measuring government real output and productivity apply for similar reasons to the non-profits.
Government outputs with true market prices are comparatively rare. One might think the small fees that are charged by governments for some specific services provide an example. But these are not ‘economically significant’ prices. SNA 2008 defines such prices as follows (para 22.28): Economically significant prices are prices that have a significant effect on the amounts that producers are willing to supply and on the amounts purchasers wish to buy. These prices normally result when: a. The producer has an incentive to adjust supply either with the goal of making a profit in the long run or, at a minimum, covering capital and other costs; and b. Consumers have the freedom to purchase or not purchase and make the choice on the basis of the prices charged.
The distinction between ‘activities’ and ‘outcomes’ is important here. If the output proxies are activities, one risks exaggerating output to the degree some activities are less successful than others. Counting students attending school is an example. Outcomes might seem to be preferable, but outcomes are influenced by many factors that are beyond the control of governments. The number of graduating students, for example, is influenced by cultural trends, parental influence, health and other things.
The federal Treasury Board Secretariat has for years asked government departments to report selected activity and outcome statistics in their annual reports, but to my knowledge these data have not been aggregated to produce departmental productivity estimates. It is interesting to observe in this context that once a set of indicators is defined for reporting purposes, government departments have an incentive to put greater emphasis on those particular activities rather than on others. This might or might not be desirable, depending on how the indicators were selected.
To be frank, when I was responsible for the national accounts prior to my retirement from Statistics Canada in 2009 I did not recognize the issue I am discussing here. Had I done so, I could have made changes.
The multi-factor productivity estimates are in Statistics Canada tables 36-10-0211-01, 36-10-0208-01 and 36-10-0217-01.
Stephen Tapp, “Bigger not better. How Canada’s public sector is delivering less for more”. MacDonald-Laurier Institute, November 2025.
This annex contains a direct quotation of selected paragraphs from System of National Accounts 2008.
Thanks for your comment.
In economics, value is determined by the forces of supply and demand. Water can be extremely valuable in circumstances where it is scarce. Or it can be very cheap, even free, in circumstances where it is abundant. We value products at their market price even though some people would be quite willing to pay more. Buyers and sellers vote with their dollars and this determines the ultimate value. The problem with most services provided by government is that this pecuniary voting process involving the forces of supply and demand does not operate fully, so there is no well-defined value for its services, as economists define the term.
In your comment I think you are referring to something economists sometimes call intrinsic value. This is more of a philosophical concept. One man may value a clean environment a lot while another may not. Who is to say which man's valuation is the right one? Some things like the air we breathe might be considered to have an infinite intrinsic value.
Alain, I believe the real issue you raise is about the composition of Canada's output, not its quantity. We should use more renewable wind, solar and hydro energy and reduce our use of carbon-based energy sources. We should spend more on low-carbon-footprint services and less on high-carbon-footprint goods such as cars and airplanes. In the case of non-business sector output (my topic), government should restructure the composition of the services it provides to focus more on low-carbon-footprint activities, such as providing more timely justice administration and assisting the needy.
Most would agree it is a good thing to have more government output if we can achieve that without increasing taxes, by raising productivity. An obsession with economic growth is not bad in itself. It is the choices we make as a society about what types of goods and services to produce with our production capabilities. Surely it's not a bad thing for us all to have higher incomes. With that we can raise the standard of living of the less fortunate, provide better health care and education to everyone and generally live more enriching lives. The problem is not how much income we have, it is rather how we as a society choose to spend that income. We should not try to save the ecology by impoverishing ourselves. There are better ways.