

Assessing Canada's potential output growth
Assessing Canada's potential output growth
The recent surge in population growth and prolonged weakness in labour productivity make it difficult to discern Canada's potential economic growth at this juncture

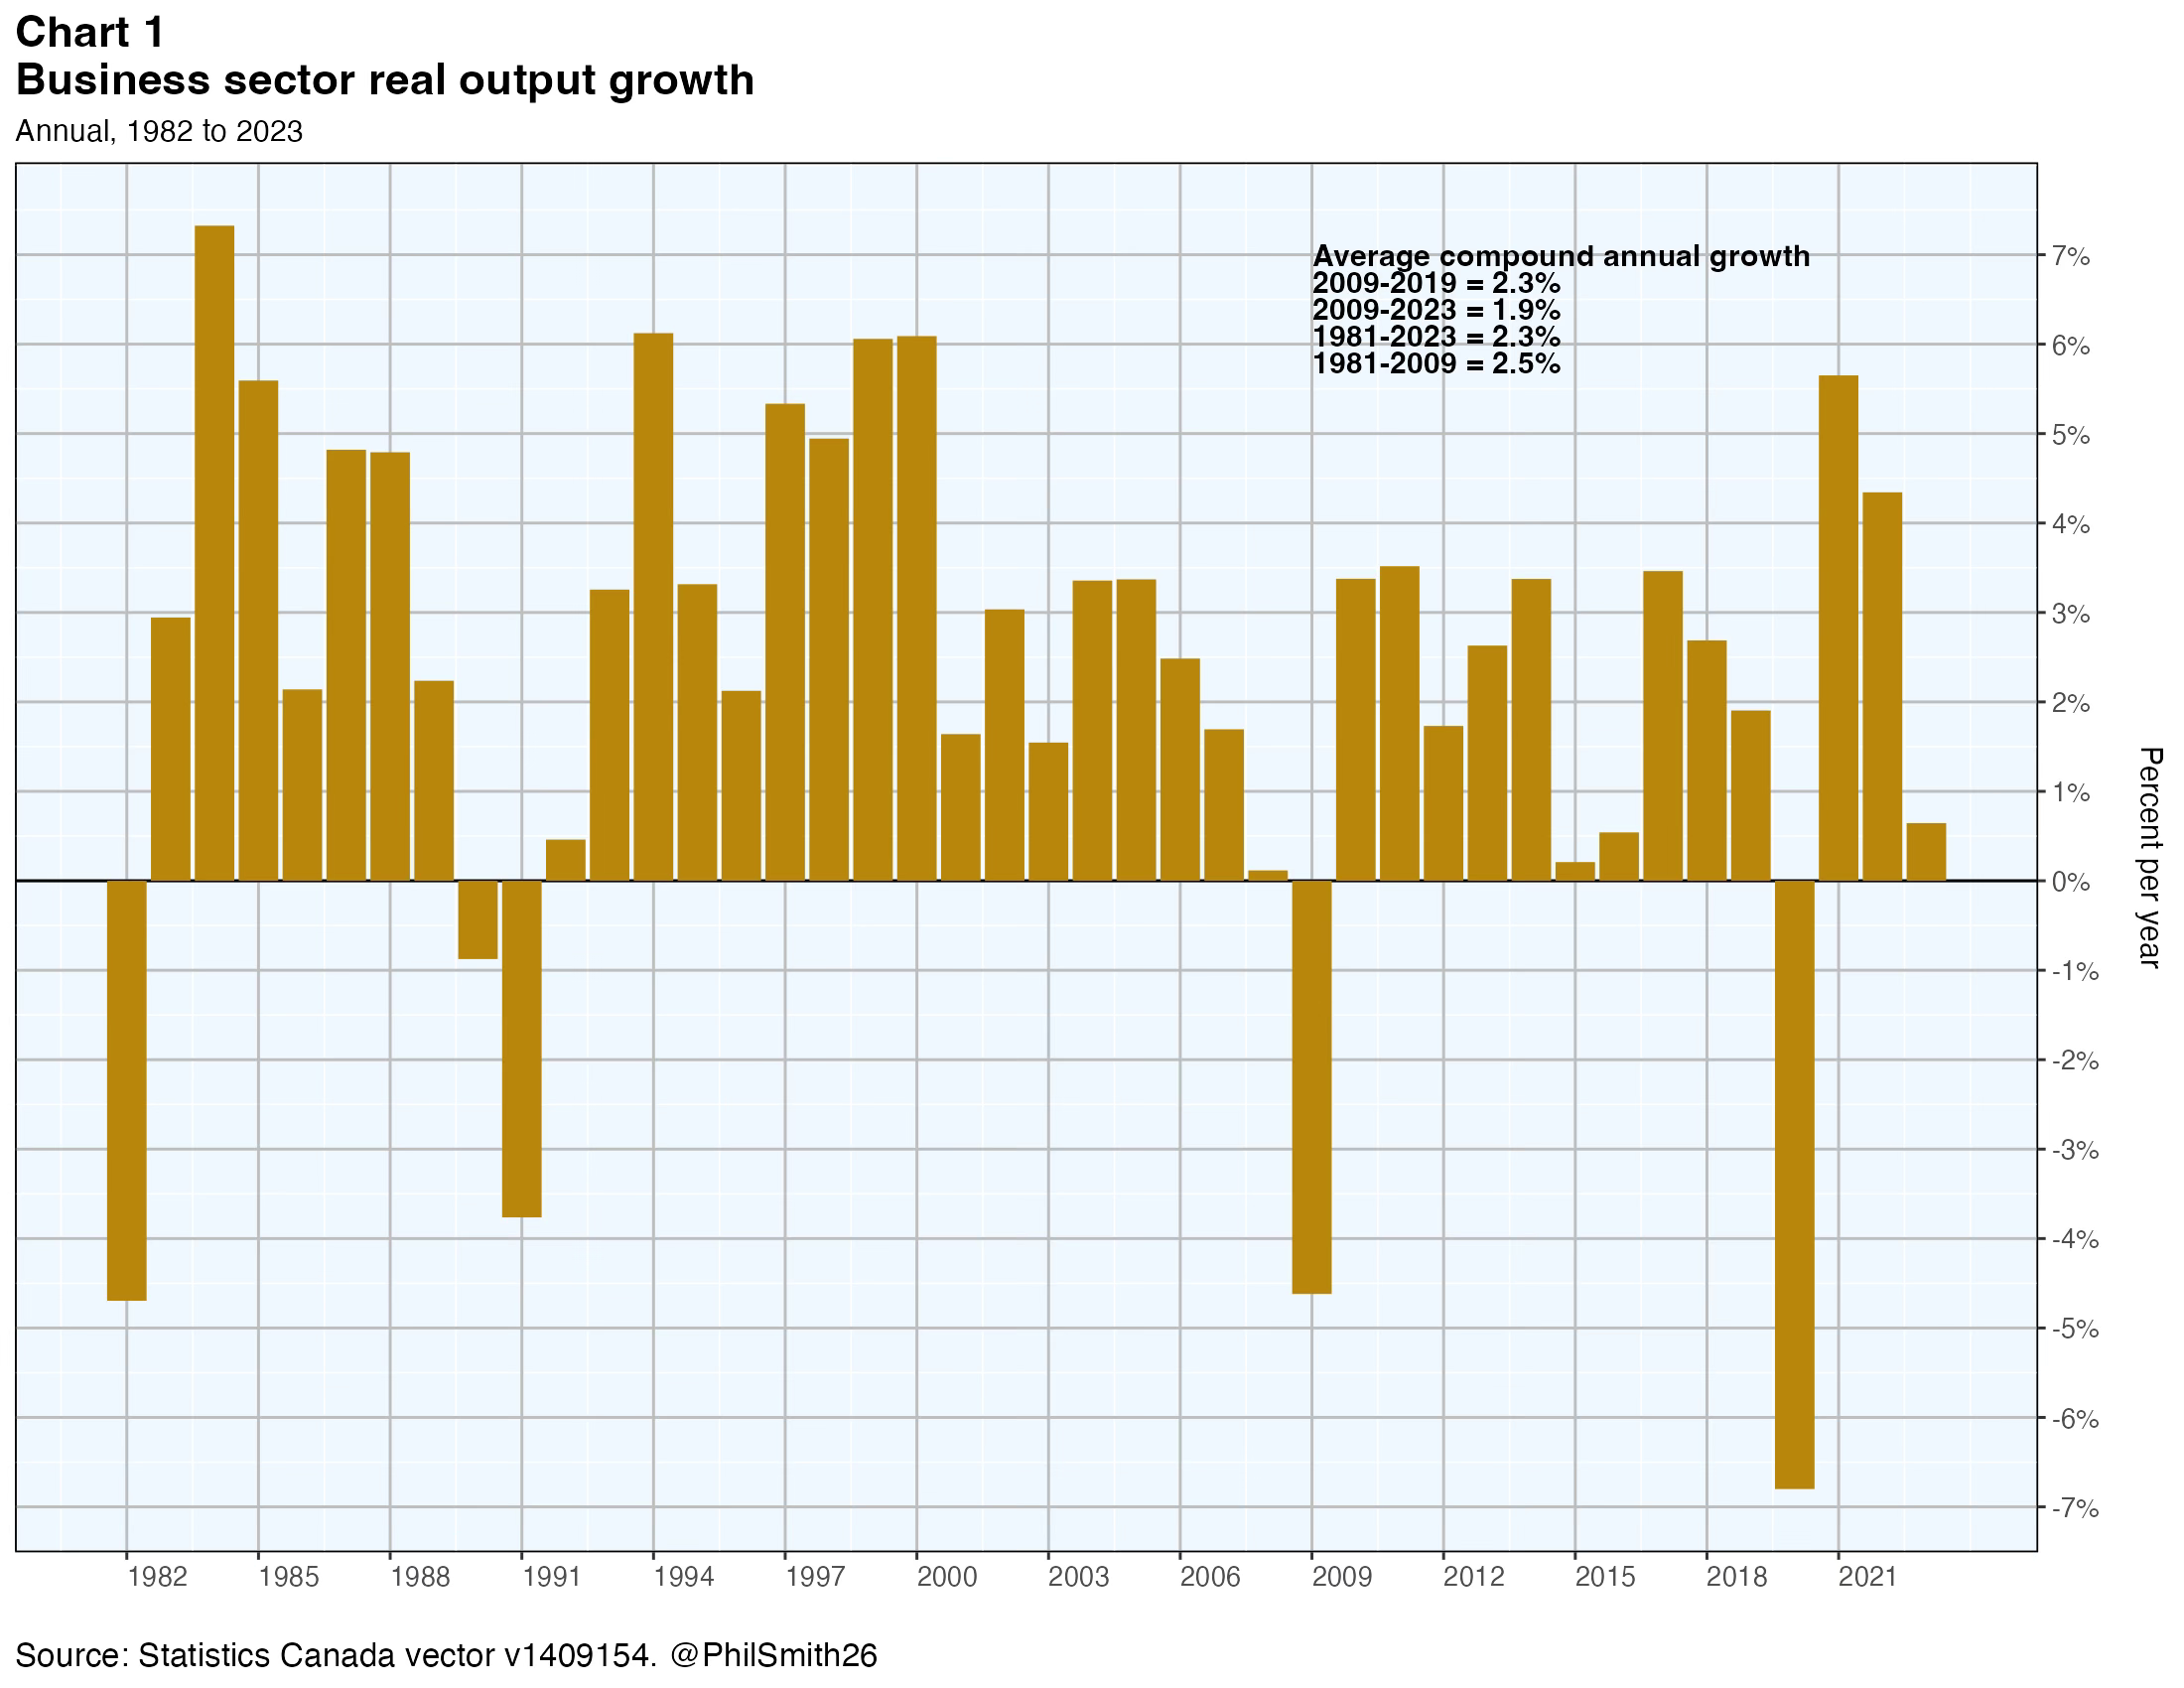
Economic growth, or lack thereof, is perhaps the number one topic that many economists and policy-makers are focussed on. The historical pattern of this growth is shown in Chart 1.1 Statistics Canada puts a lot of effort into measuring growth because of its great importance.2 But what is and what has been the country’s potential economic growth?
This is an important question for macroeconomic planners and policy-makers. If actual growth is considerably less than potential growth it means we are “leaving possible income and output on the table” and allowing more people to suffer the effects of unemployment. Our economic engine is running at less than full capacity. This is usually considered undesirable, although since it implies the economy is running “cool” it may nevertheless be what is needed at times. This may be the case if inflation is too high. On the other hand, if this “output gap” — the difference between actual output and potential output — is positive, meaning the current rate of economic growth exceeds the potential rate, then the situation is unsustainable and is likely to push up the inflation rate and, possibly, drive the economy into recession. Yes, it is possible for output to exceed potential for a short while, with people working extra shifts and businesses forgoing normal maintenance of their capital assets. But this cannot continue indefinitely.
So potential output is an important concept, especially for the macroeconomic policy-makers in the Bank of Canada and Finance Canada. But unfortunately it defies direct measurement. So economists have devised ways of estimating it indirectly, through a variety of models and methods.
Bank of Canada analysis of potential output
The Bank of Canada’s practice in recent years has been to conduct ongoing research on the topic of potential output growth and the output gap,3 while providing an update to Canadians in April each year when the Monetary Policy Review is released in that month. I imagine we can expect a similar update this year.
What will be the most interesting issues discussed in that update? My guess is they will revolve around the unexpectedly large surge in non-permanent residents — foreign students and temporary foreign workers in particular — and the continuing weak statistics on labour productivity since the previous update.
A year ago the Bank revised its estimates of potential real GDP growth from 1.7% to 1.4% for 2022, from 3.3% to 2.3% for 2023 and from 2.5% to 2.1% for 2024. The main reason cited for these downward revisions was the global supply disruptions that had been observed in 2022. Actual growth in 2022 is currently estimated by Statistics Canada to be 3.8%, implying a positive output gap of 2.4% in that year. It was indeed a strong year for growth and this was reflected as well in the burst of inflation accompanying it. Statistics Canada’s estimate for growth in the following year, 2023, was just 1.1%, implying a negative output gap of -1.2%. Global supply disruptions no longer seem to be a problem.
How might the updated picture, to be unveiled by the Bank next month, differ from this one? To address the question one must consider the Banks’ methodology for assessing potential output growth.
Measuring potential output
The Bank of Canada uses a multi-step process to estimate potential output and the output gap. They have described it briefly in the paragraph below.
“In the current approach, Bank staff use the IF [Integrated Framework] and the modified EMVF [Extended Multivariate Filter] to build a base-case estimation, and use the IF to project potential. They then consider other sources of information, including various labour market indicators and information coming from the Bank’s Business Outlook Survey (BOS), to apply judgment and arrive at final estimates and projections. The Bank’s Governing Council may add judgment to form its own estimate and projection. When all of this information and the new methodologies are taken into consideration, it is believed that the Bank now has more balanced and reliable estimates of potential output and the output gap.”4
This brief explanation is somewhat out of date because it was written in 2015 and the Bank has continued to make refinements to its methodology since then. But as far as I can tell, it remains essentially correct in its essence. There is no magic formula yielding estimated potential output growth. Rather, a number of alternative analytical methods are applied, each yielding their own results. These are then blended judgementally with additional information from various sources and discussed up the line until final estimates are decided upon for purposes of the Monetary Policy Review document.
It is of course impossible for anyone to replicate this process or to conduct sensitivity analysis around it, so I will not try to do that. But the Bank does report that its 2.3% estimate for potential output growth in 2023 was comprised of 1.5% trend growth in the labour input and 0.8% trend growth in labour productivity. Its 2.1% estimate for potential output growth in 2024 was comprised of 1.3% trend growth in the labour input and 0.8% trend growth in labour productivity. It is interesting to consider these estimates in the light of the actual outcome in the eleven months since they were released by the Bank.
Trend growth in the labour input
The Bank did foresee an increase in immigration in 2023, with that term defined to include non-permanent residents. That is a primary reason why its estimate for trend labour input growth increased from 1.2% in 2022 to 1.5% in 2023. Population is defined by the Bank to be persons aged 15 and older and this variable increased 1.4% in 2022 according to the Labour Force Survey. The Bank expected it to grow 1.9% in 2023, but in fact it increased 2.2%, again based on LFS data.
The LFS contains statistics on population growth by age group, broken down into three groups: ‘Born in Canada’, ‘Landed immigrants’ and ‘Other’ (a residual readily calculated but not shown explicitly in Statistics Canada table 14-10-0084-01, from which these time series are all obtained). The ‘Other’ category is a kind of proxy for non-permanent residents, although evidence from another Statistics Canada table (17-10-0121-01) suggests the LFS estimate is much too low.5 Chart 2 shows the monthly time path of this residual LFS variable through to February 2024.
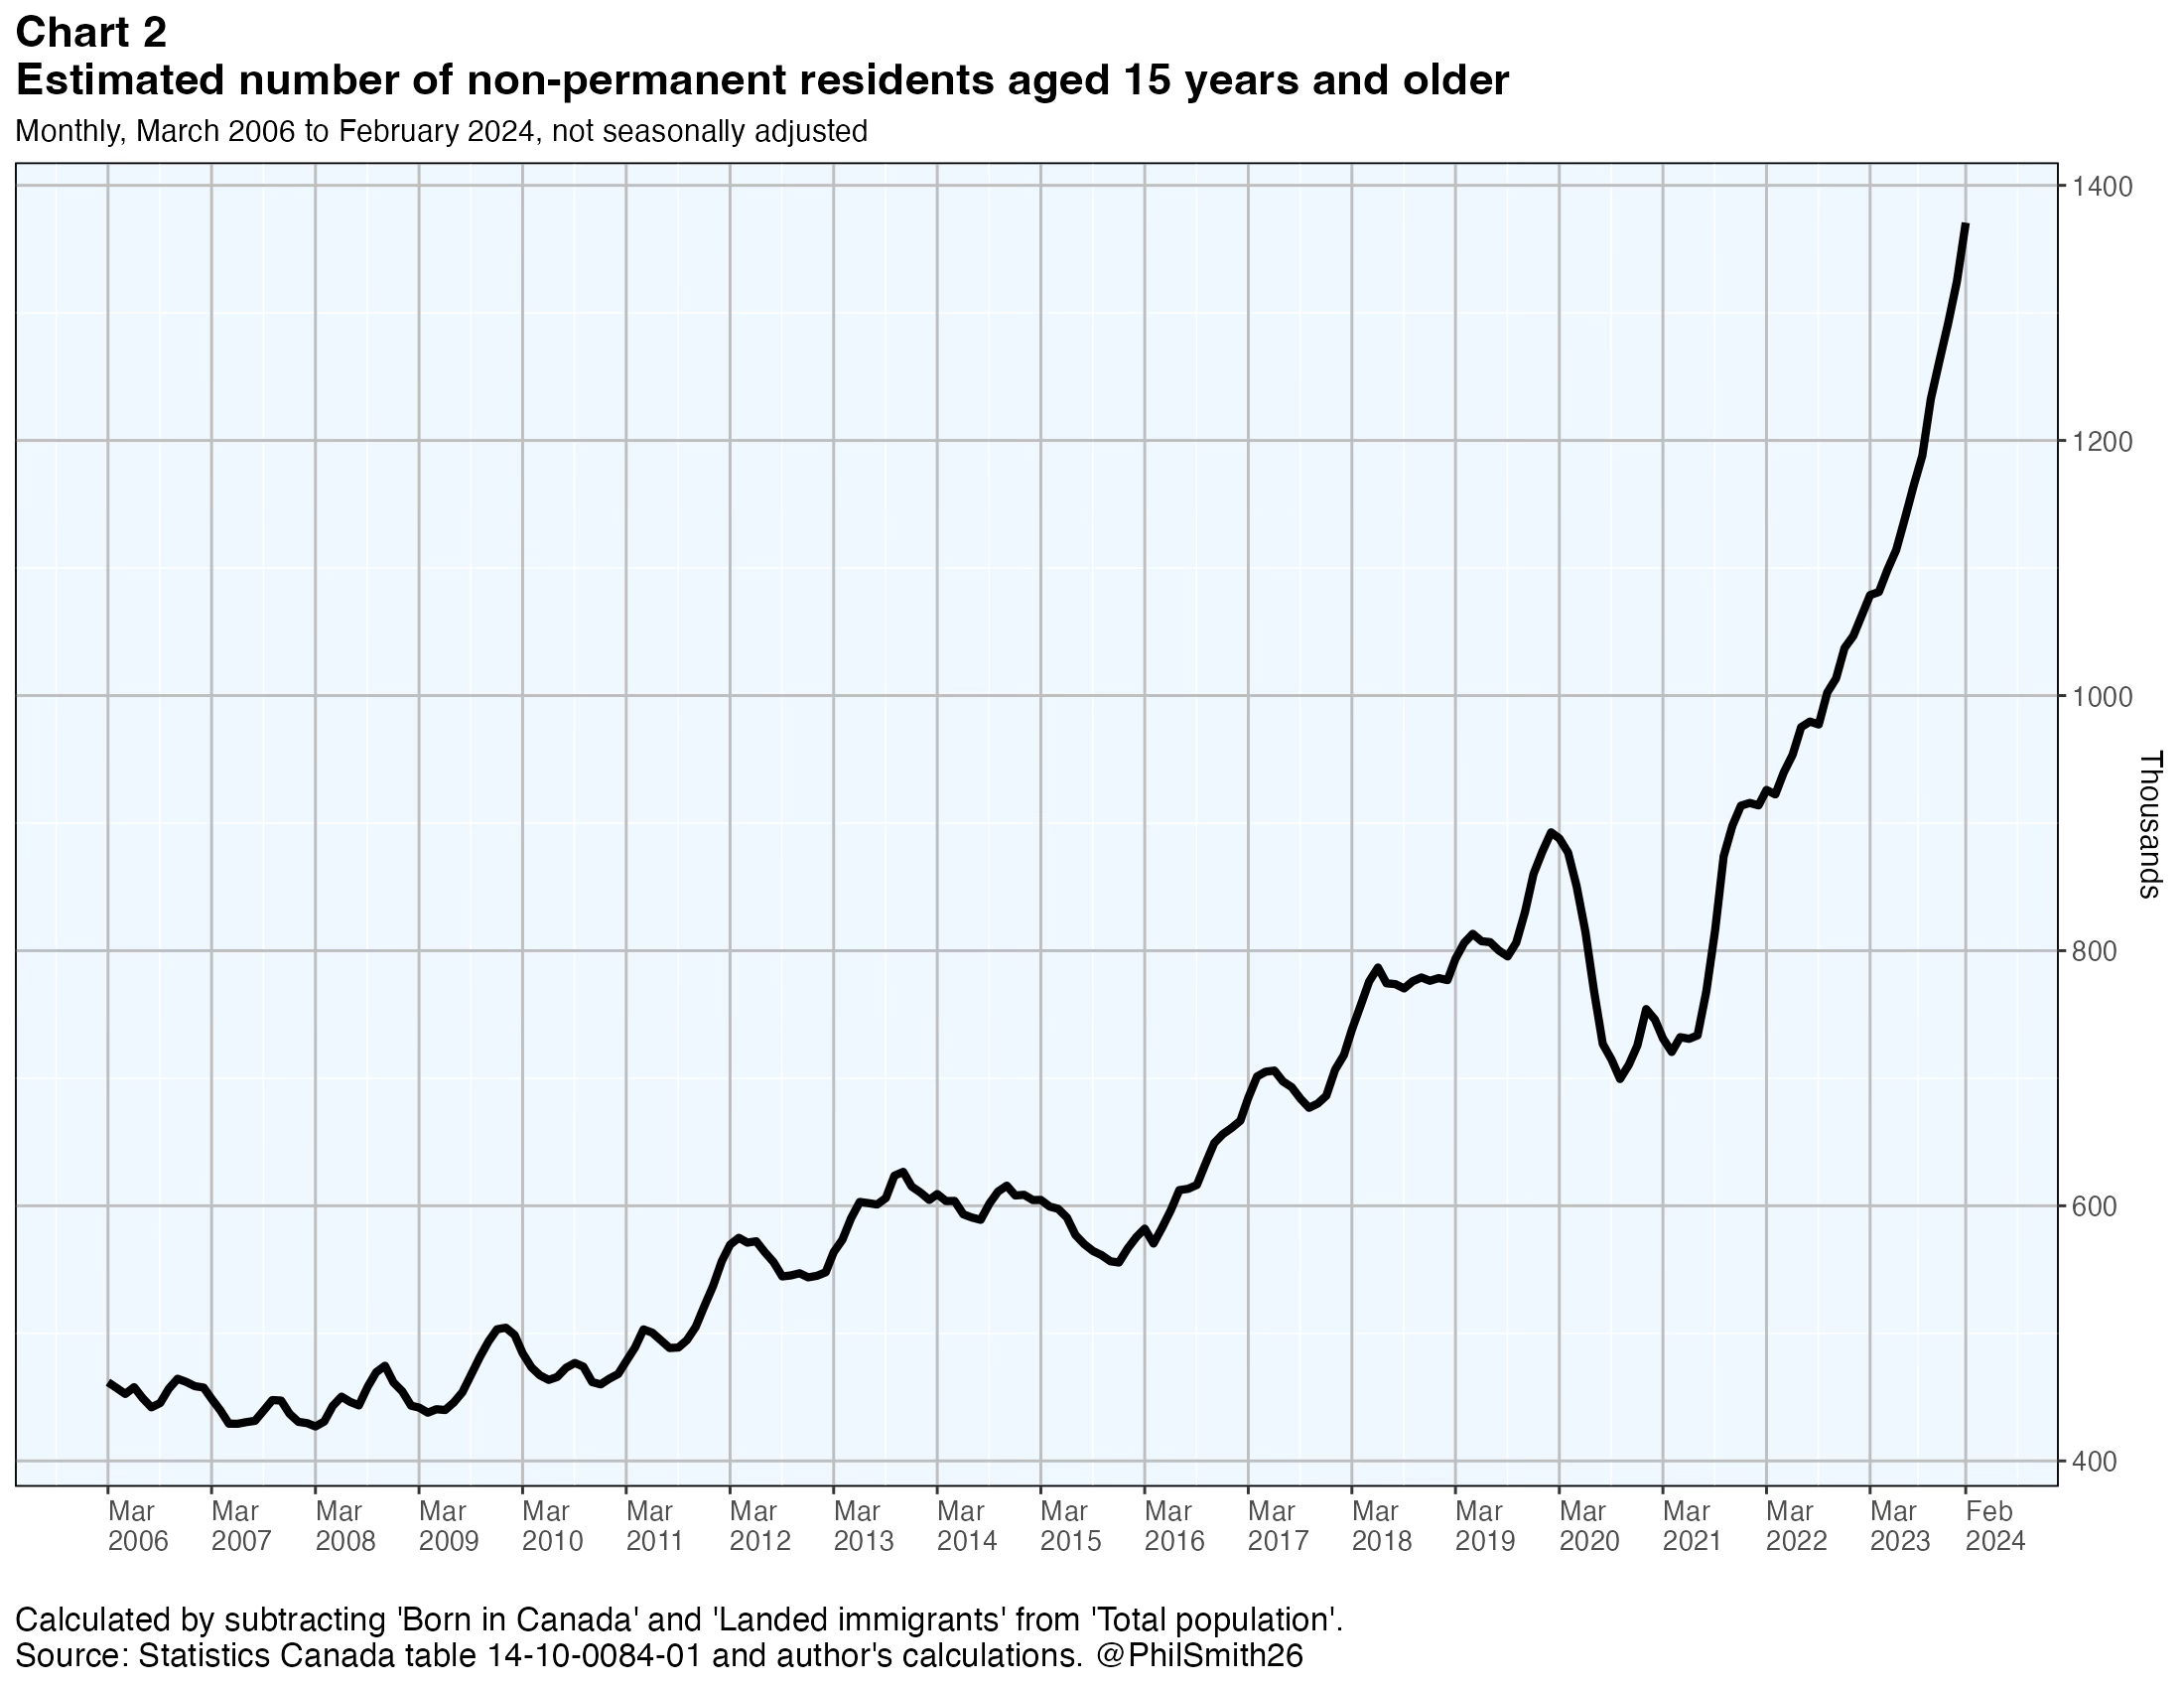
A year ago the Bank expected population growth to decline slightly to 1.7% in 2024 from 1.9% in 2023. Does that now look reasonable? In the 50 years prior to 2023 Canada’s population grew at a 1.1% average rate with a standard deviation of 0.2%. In the years since 2000 all of the other G7 countries have had average population growth rates lower than 1.1%. Should we really expect Canada’s population to continue growing at these extraordinarily high rates?
The government has already indicated it is taking steps this year to moderate the forces that caused our population to grow so much in 2022 and 2023. In particular, it served notice that it would apply limits on the number of student visas allowed, and said this would have the effect of reducing foreign student numbers by about 35% in 2024 compared to 2023. But the largest single component of our non-permanent resident population is temporary foreign workers and to my knowledge the government has not yet said what it will do, if anything, to stem the growth or indeed reduce the numbers of this kind of temporary resident worker this year. The LFS data in Chart 2, to February 2024, show no signs yet of a change in trend.
The natural rate of increase of the population, births minus deaths, is stable at around 30,000 per year which is tiny in relation to our total population of over 40 million people. Landed immigration is explicitly targeted and managed by the government and is likely to be between 400,000 and 500,000. Net additional asylum claimants might be 100,000 or so, depending on a variety of factors. The interesting question is what the growth, or decline, in the numbers of temporary foreign workers and foreign students will be.
So broadly speaking, one can imagine three very different population growth outcomes.
In the first of these, the recent trend in Chart 2 is projected to continue for temporary foreign workers. In effect, businesses continue to take advantage of cheap labour from abroad and the government does nothing to slow the process down or reverse it. If this LFS-based trend is taken as indicative of the entire temporary foreign worker group, total population growth in 2024 could be between 2% and 2.5% despite the new limits imposed on student visas.
In the second scenario, the government is assumed to take further strong action, and soon, to cut back on the number of temporary foreign workers in Canada in 2024. Statistics Canada says there were 1.2 million6 such temporary work permit holders in Canada in the fourth quarter of 2023, double the number two years previously. If action were taken that was enough to bring the number of temporary foreign workers back down to its level in 2021, that in itself would reduce population growth by 1.5 percentage points. Adding in the cutback in student visas already announced by the Minister of Immigration could mean a further reduction of 0.8% in the total population growth rate. This scenario would surely imply negative growth in the total population in 2024 since natural population growth plus landed immigration could only be expected to add about 1.1% to total population growth.
Finally, in a third scenario the government might “cut the baby in half”, as in the story of King Solomon, seeking some kind of middle solution with total population growing a lot less than the 2.2% seen in 2023 but substantially more than zero. This could be done by tightening up the rules for businesses wanting to hire temporary foreign workers, but not to the extent that the number of foreign workers in Canada decreases substantially.
It will be very interesting to see how the Bank works its way through this puzzle to estimate population growth in 2024 and beyond.
Trend growth in the labour productivity
Chart 3 shows two trend lines for labour productivity. The long-term trend, using data from 1981 to 2023, implies 1.3% growth per year, while the shorter-term trend from 2008 to 2023 implies 0.9%.
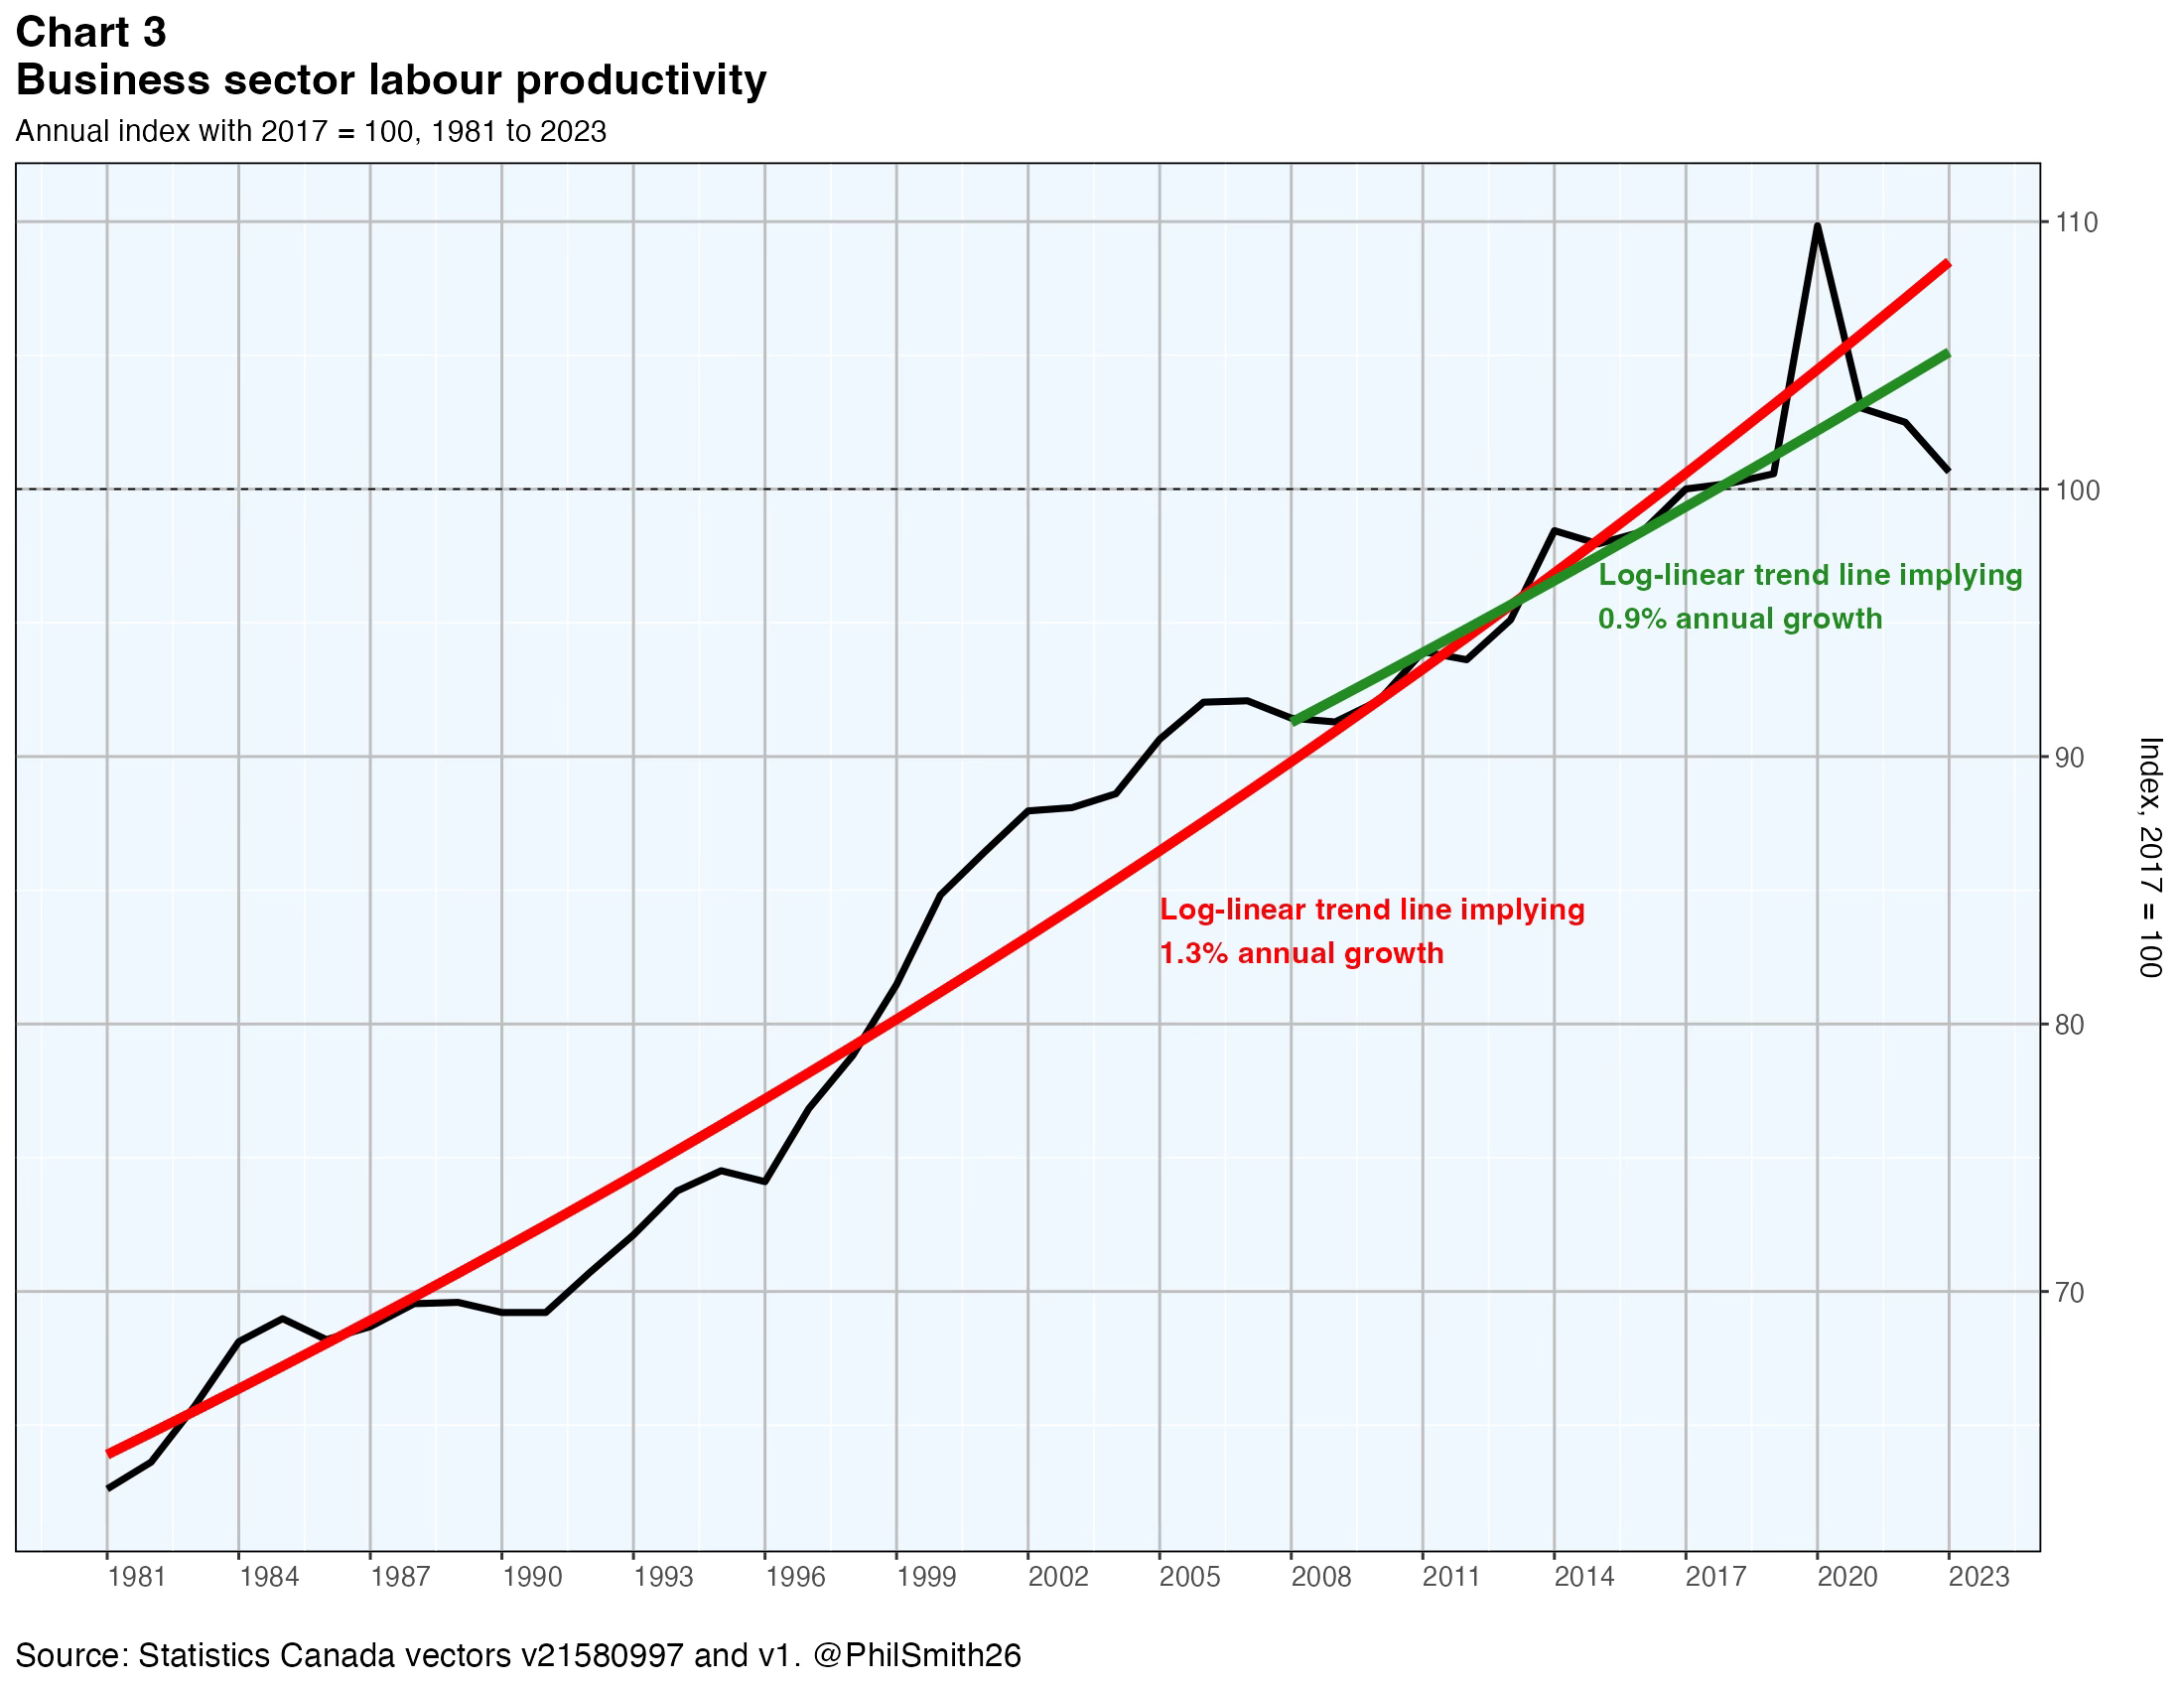
A year ago the Bank estimated trend labour productivity at 0.2% in 2022 and 0.8% in 2023 and 2024. With the data now available, actual labour productivity growth was -0.5% in 2022 and -1.8% in 2023. How will the Bank take this additional information into account for its updated estimates of potential output and the output gap?
Again, this is hard to predict. One way forward would be to interpret the two-year decline in labour productivity as a cyclical phenomenon. Cyclical downturns in productivity do occur from time to time and when they do, it is usually related to a recession. Once the recession is over and recovery occurs, a robust rebound in productivity can be expected. This scenario could imply holding to the 0.8% trend productivity growth assumption despite the two negative growth years. After all, labour productivity did increase 0.4% in the fourth quarter of 2023, after the string of five negative quarters. If economic growth strengthen in 2024, arguably, productivity growth should as well.
However, it is not generally believed Canada is presently or has recently been in a recession. The unemployment rate has risen since mid 2022, but not all that much as it remained at 5.8% as of February. This is very low by historical standards. Moreover, the growth in LFS employment was 2.3% over the latest three months, expressed at an annual rate, and real GDP rose 2.4% in the three months to January on the same basis. These are not the marks of recession. So perhaps this decline in labour productivity should be regarded as more structural in nature, rather than cyclical. This would argue for reducing the estimated trend growth in productivity to something lower than 0.8%.
Conclusion
Frankly I am not quite sure what to conclude from this analysis, except that I will be very interested to see how the Bank handles this challenge. Conclusions about potential GDP and the output gap do not usually depend on what happens to population growth, since that component of the picture has been fairly stable and predictable for decades. The experience of 2022 and 2023, with sharp and unexpected increases in population, has not been seen before, at least not in the last half century. It would be one thing if this increase was new immigrants of the traditional kind, selected through the points system to have the education and skills that help meet the occupational employment needs of Canada. But that is far from true. The recent surge in population is one of temporary rather than new permanent residents:
people from other countries brought in by businesses to fill low-skill, low-wage jobs that are supposedly temporary but may be extended;
young people on student visas who also want to work and who in many cases hope to transition somehow to permanent resident status; and
asylum claimants who may or may not be accepted eventually as permanent residents of Canada.
This is a different kind of population growth and its impact on potential output is more difficult to discern.
Annex
Bank of Canada estimates of potential output
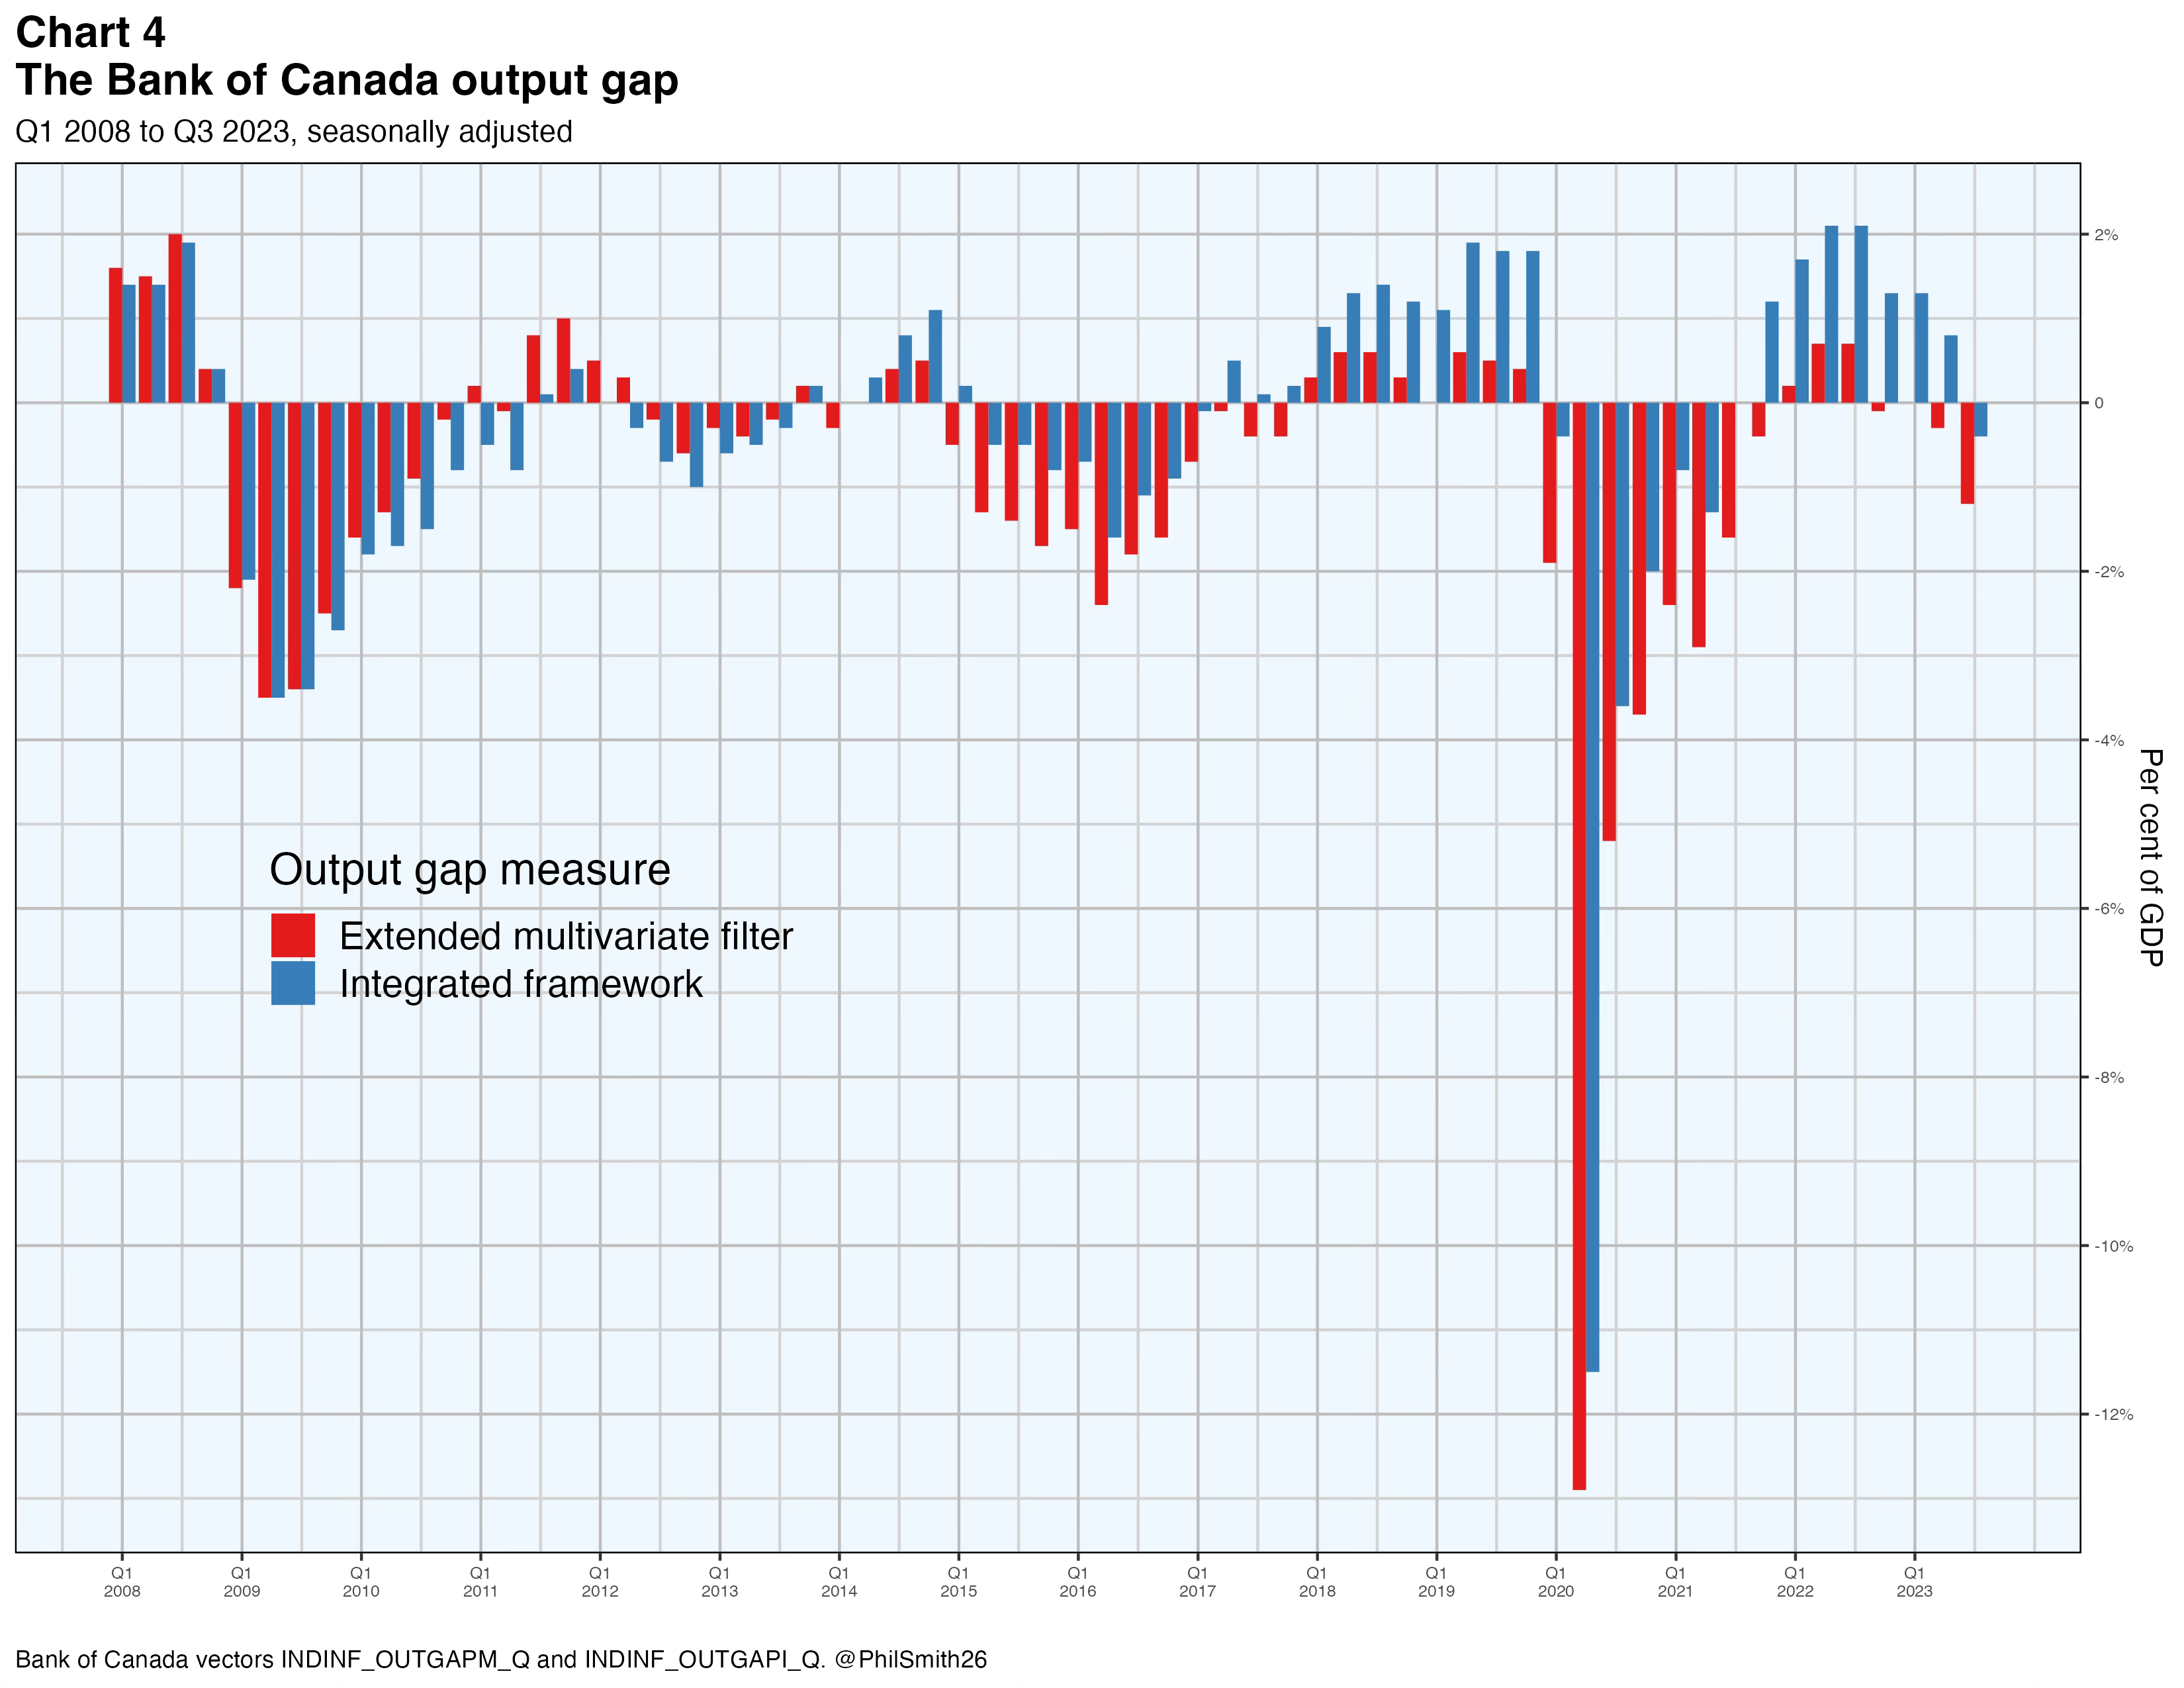
The IF and EMVF mentioned in the paper are described in detail in the cited Bank of Canada references. The currently available, although out of date estimates for IF and EMVF are shown in Chart 4 below. As can be seen, both measures imply the economy moved from a positive to a negative output gap between 2022 and 2023.
The Bank’s final estimates last year were those shown in the April 2023 Monetary Policy Review and are reproduced in its Chart A-1 below.
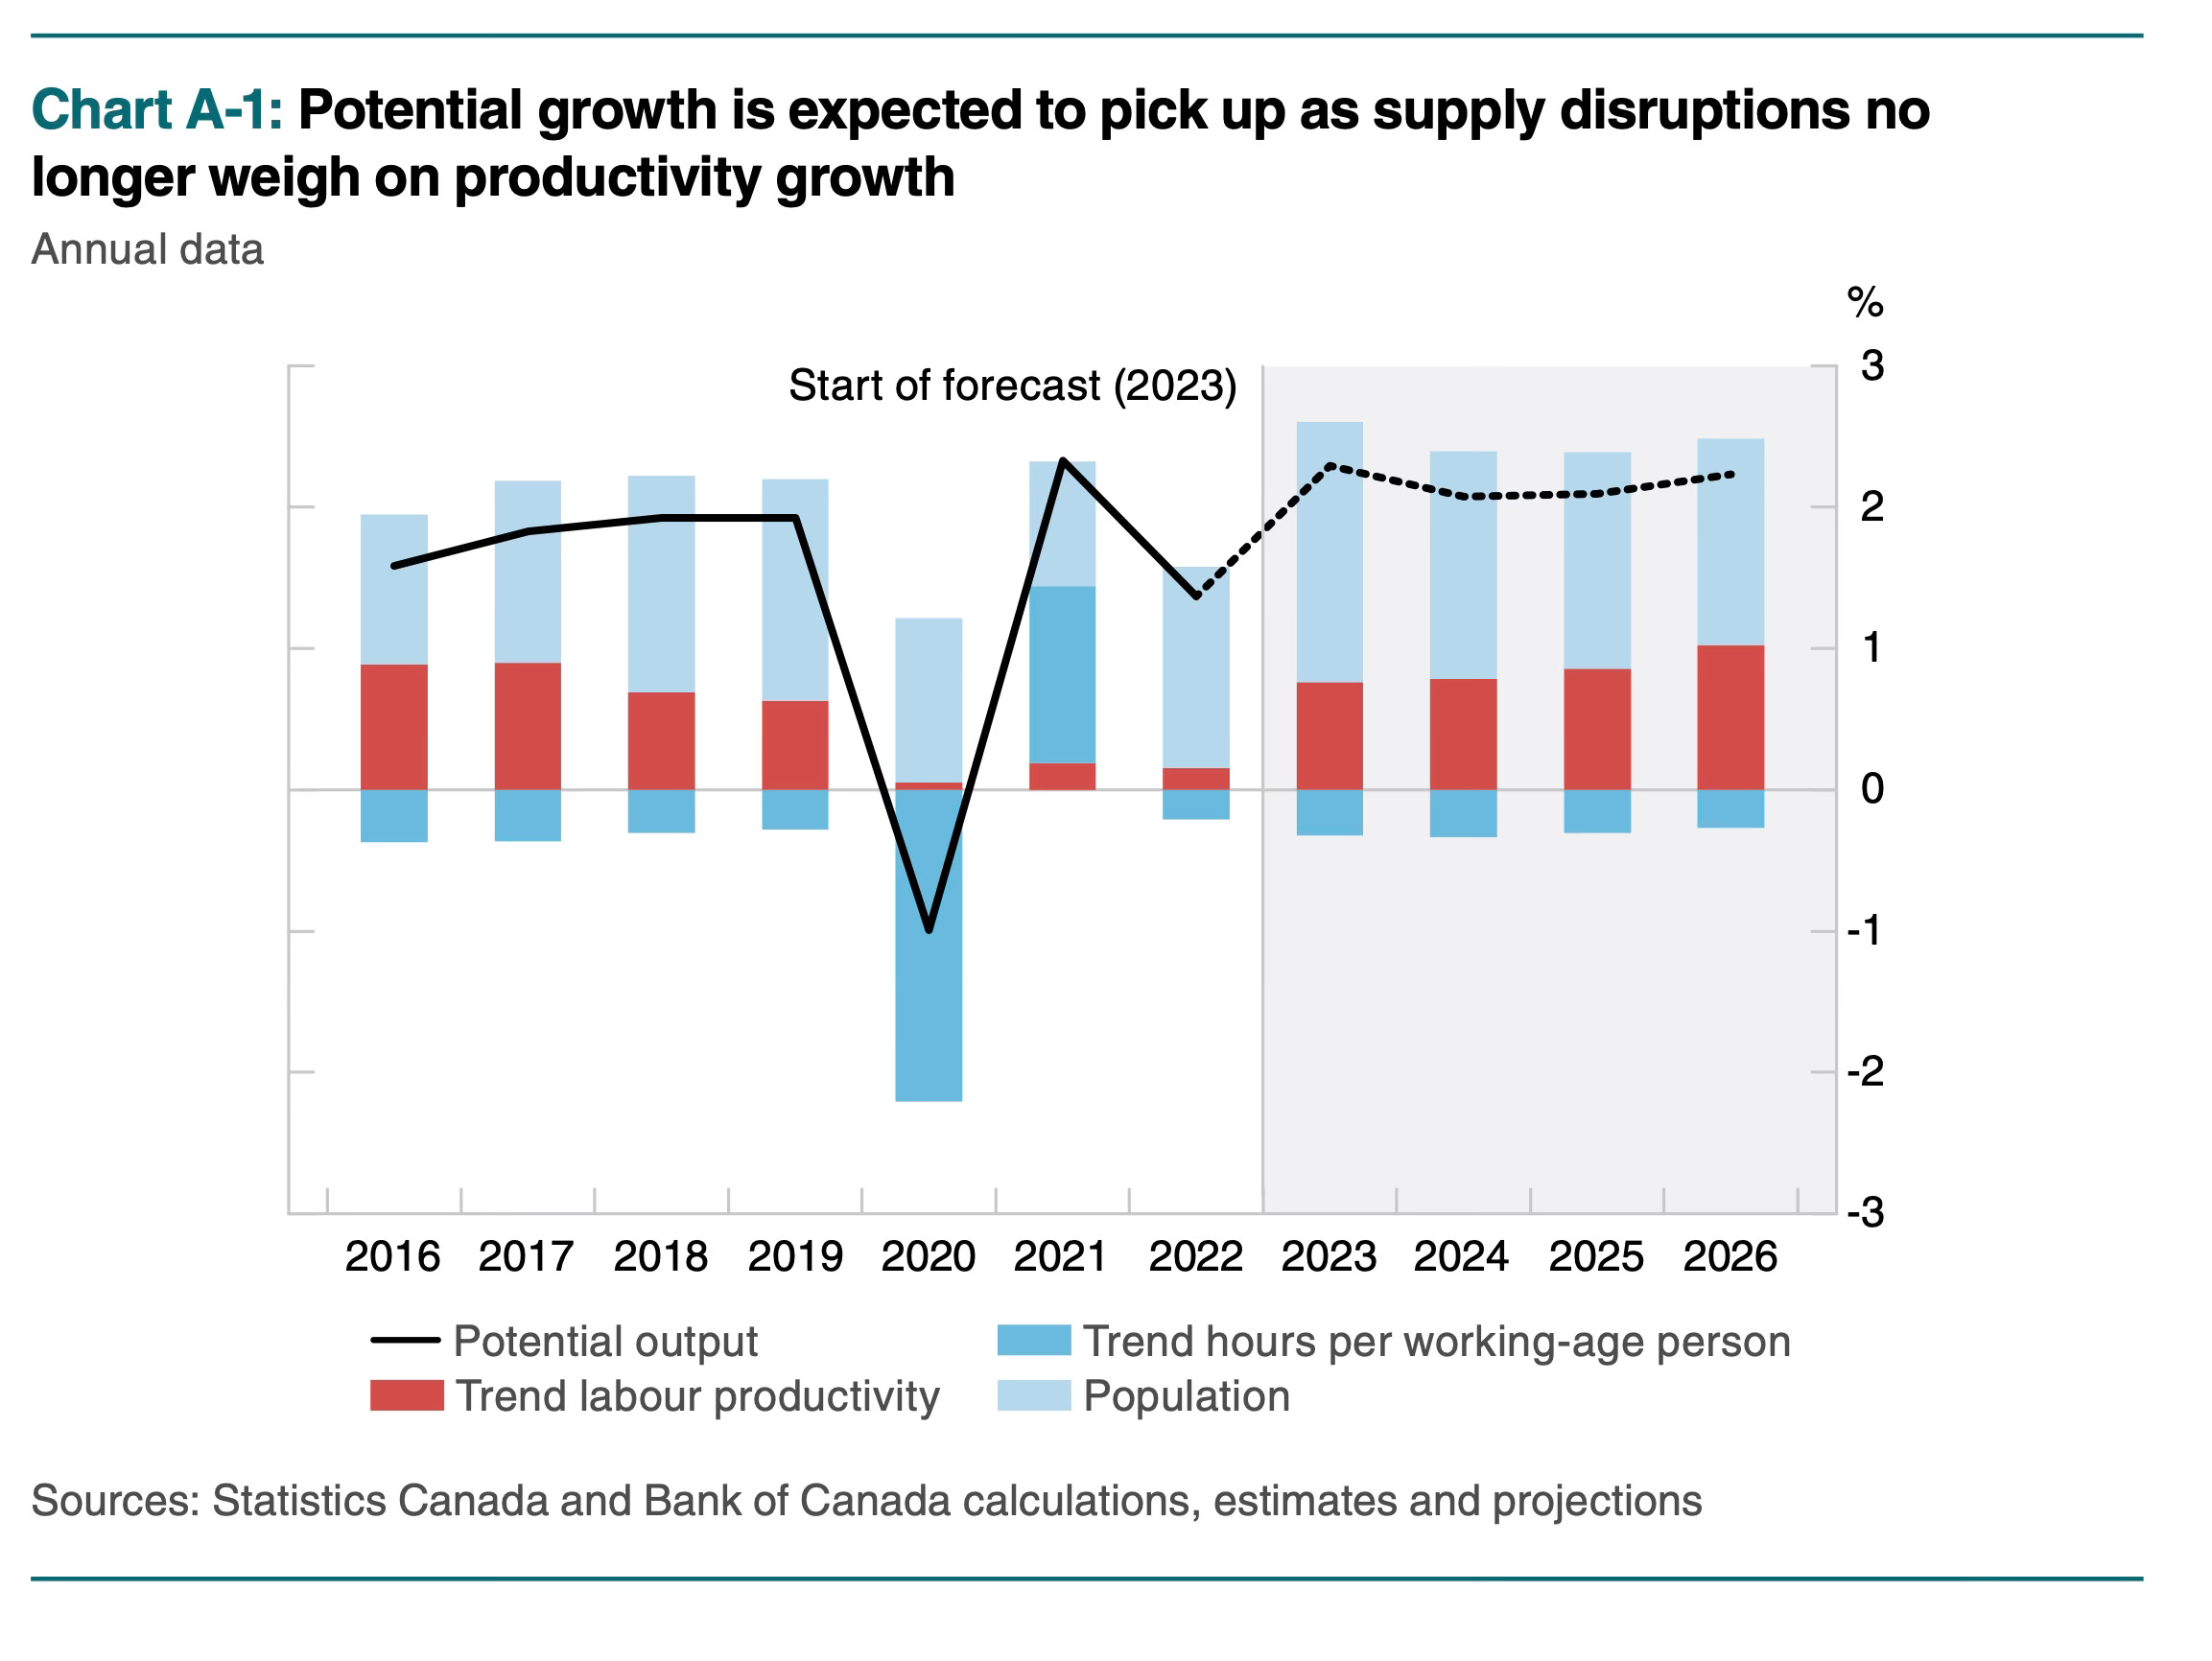
Like everyone else, the Bank only partially foresaw the surge in non-permanent residents, expecting total population growth of 1.9% in 2023, dropping back down to about 1.3% by 2026. It expected trend productivity growth of about 0.8% in 2023 increasing gradually to 1% by 2026.
The focus in this paper is on business sector GDP, rather than total output growth. Non-business GDP, including the government and non-profit sectors, has no well-determined valuation, since the outputs are mostly not sold in the marketplace. Productivity change is ill-defined in this part of the economy.
Statistics Canada releases an estimate of Canada’s economic growth every month, broken down in considerable detail by industry. On a quarterly basis the agency releases additional information about our economic growth: the factor incomes earned and the types of final expenditure associated with that growth. And on an annual basis, with a two-year lag, it releases even more detail about economic growth in the supply and use tables.
See in particular Lise Pichette, Pierre St-Amant, Ben Tomlin, Karine Anoma, “Measuring Potential Output at the Bank of Canada: The Extended Multivariate Filter and the Integrated Framework,” Bank of Canada Staff discussion Paper 15-1, January 2015; Faucher, G., C. Hajzler, M. Kuncl, D. Matveev, Y. Park and T. Taskin, “Potential Output and the Neutral Rate in Canada: 2022 Reassessment,” Staff Analytical Note—2022-3, April 13, 2022; Julien Champagne, Christopher Hajzler, Dmitry Matveev, Harlee Melinchuk, Antoine Poulin-Moore, Kemal Ozhan, Youngmin Park and Temel Taskin, “Potential output and the neutral rate in Canada: 2023 assessment,” Staff Analytical Note—2023-6, May 11, 2023.
See page 3 in Lise Pichette, Pierre St-Amant, Ben Tomlin, Karine Anoma, “Measuring Potential Output at the Bank of Canada: The Extended Multivariate Filter and the Integrated Framework,” Bank of Canada Staff discussion Paper 15-1, January 2015.
Statistics Canada table 17-10-0121-01 states the number of non-permanent residents in Canada was 2.5 million at the end of 2023 whereas the LFS residual (implicit) number is about 1.2 million. The 2.5 million number is estimated using administrative data from Immigration, Refugees and Citizenship Canada. Some of the difference is accounted for by non-permanent residents who are under 15 years of age, but it seems likely the big majority of the 2.5 million non-permanent residents are 15 years and older since most of them are foreign students and temporary foreign workers.
This is Statistics Canada’s estimate for the number of non-permanent residents at the end of 2023 that had work permits only. In other words, it excludes those with no work permit, or with only a study permit, or with both a work and a study permit — that is, most asylum claimants, all students and most family members.
That's kind of you to say. Thanks.
Thank you for another great write up, always learn a lot from your work.