

Accounting for the decline of Canada's real GDP per capita since mid 2022
Accounting for the decline of Canada's real GDP per capita since mid 2022


This paper offers an explanation as to why Canada’s real GDP per capita has been declining since mid 2022. The interpretation is summarized in the above chart and is motivated and explained below.
Introduction
Real gross domestic product (GDP) per capita (or real domestic income per capita), defined as GDP with inflation removed and divided by the total population, is an important indicator of changes in Canadians’ well-being through time.1
The track of GDP per capita over the last 77 years reveals a strong upward trend, with the index more than tripling over the entire period (Figure 1). The upward trend is interrupted occasionally and these disruptions are closely related to the business cycle (the C.D. Howe Institute’s dates for Canadian recessions are shaded).
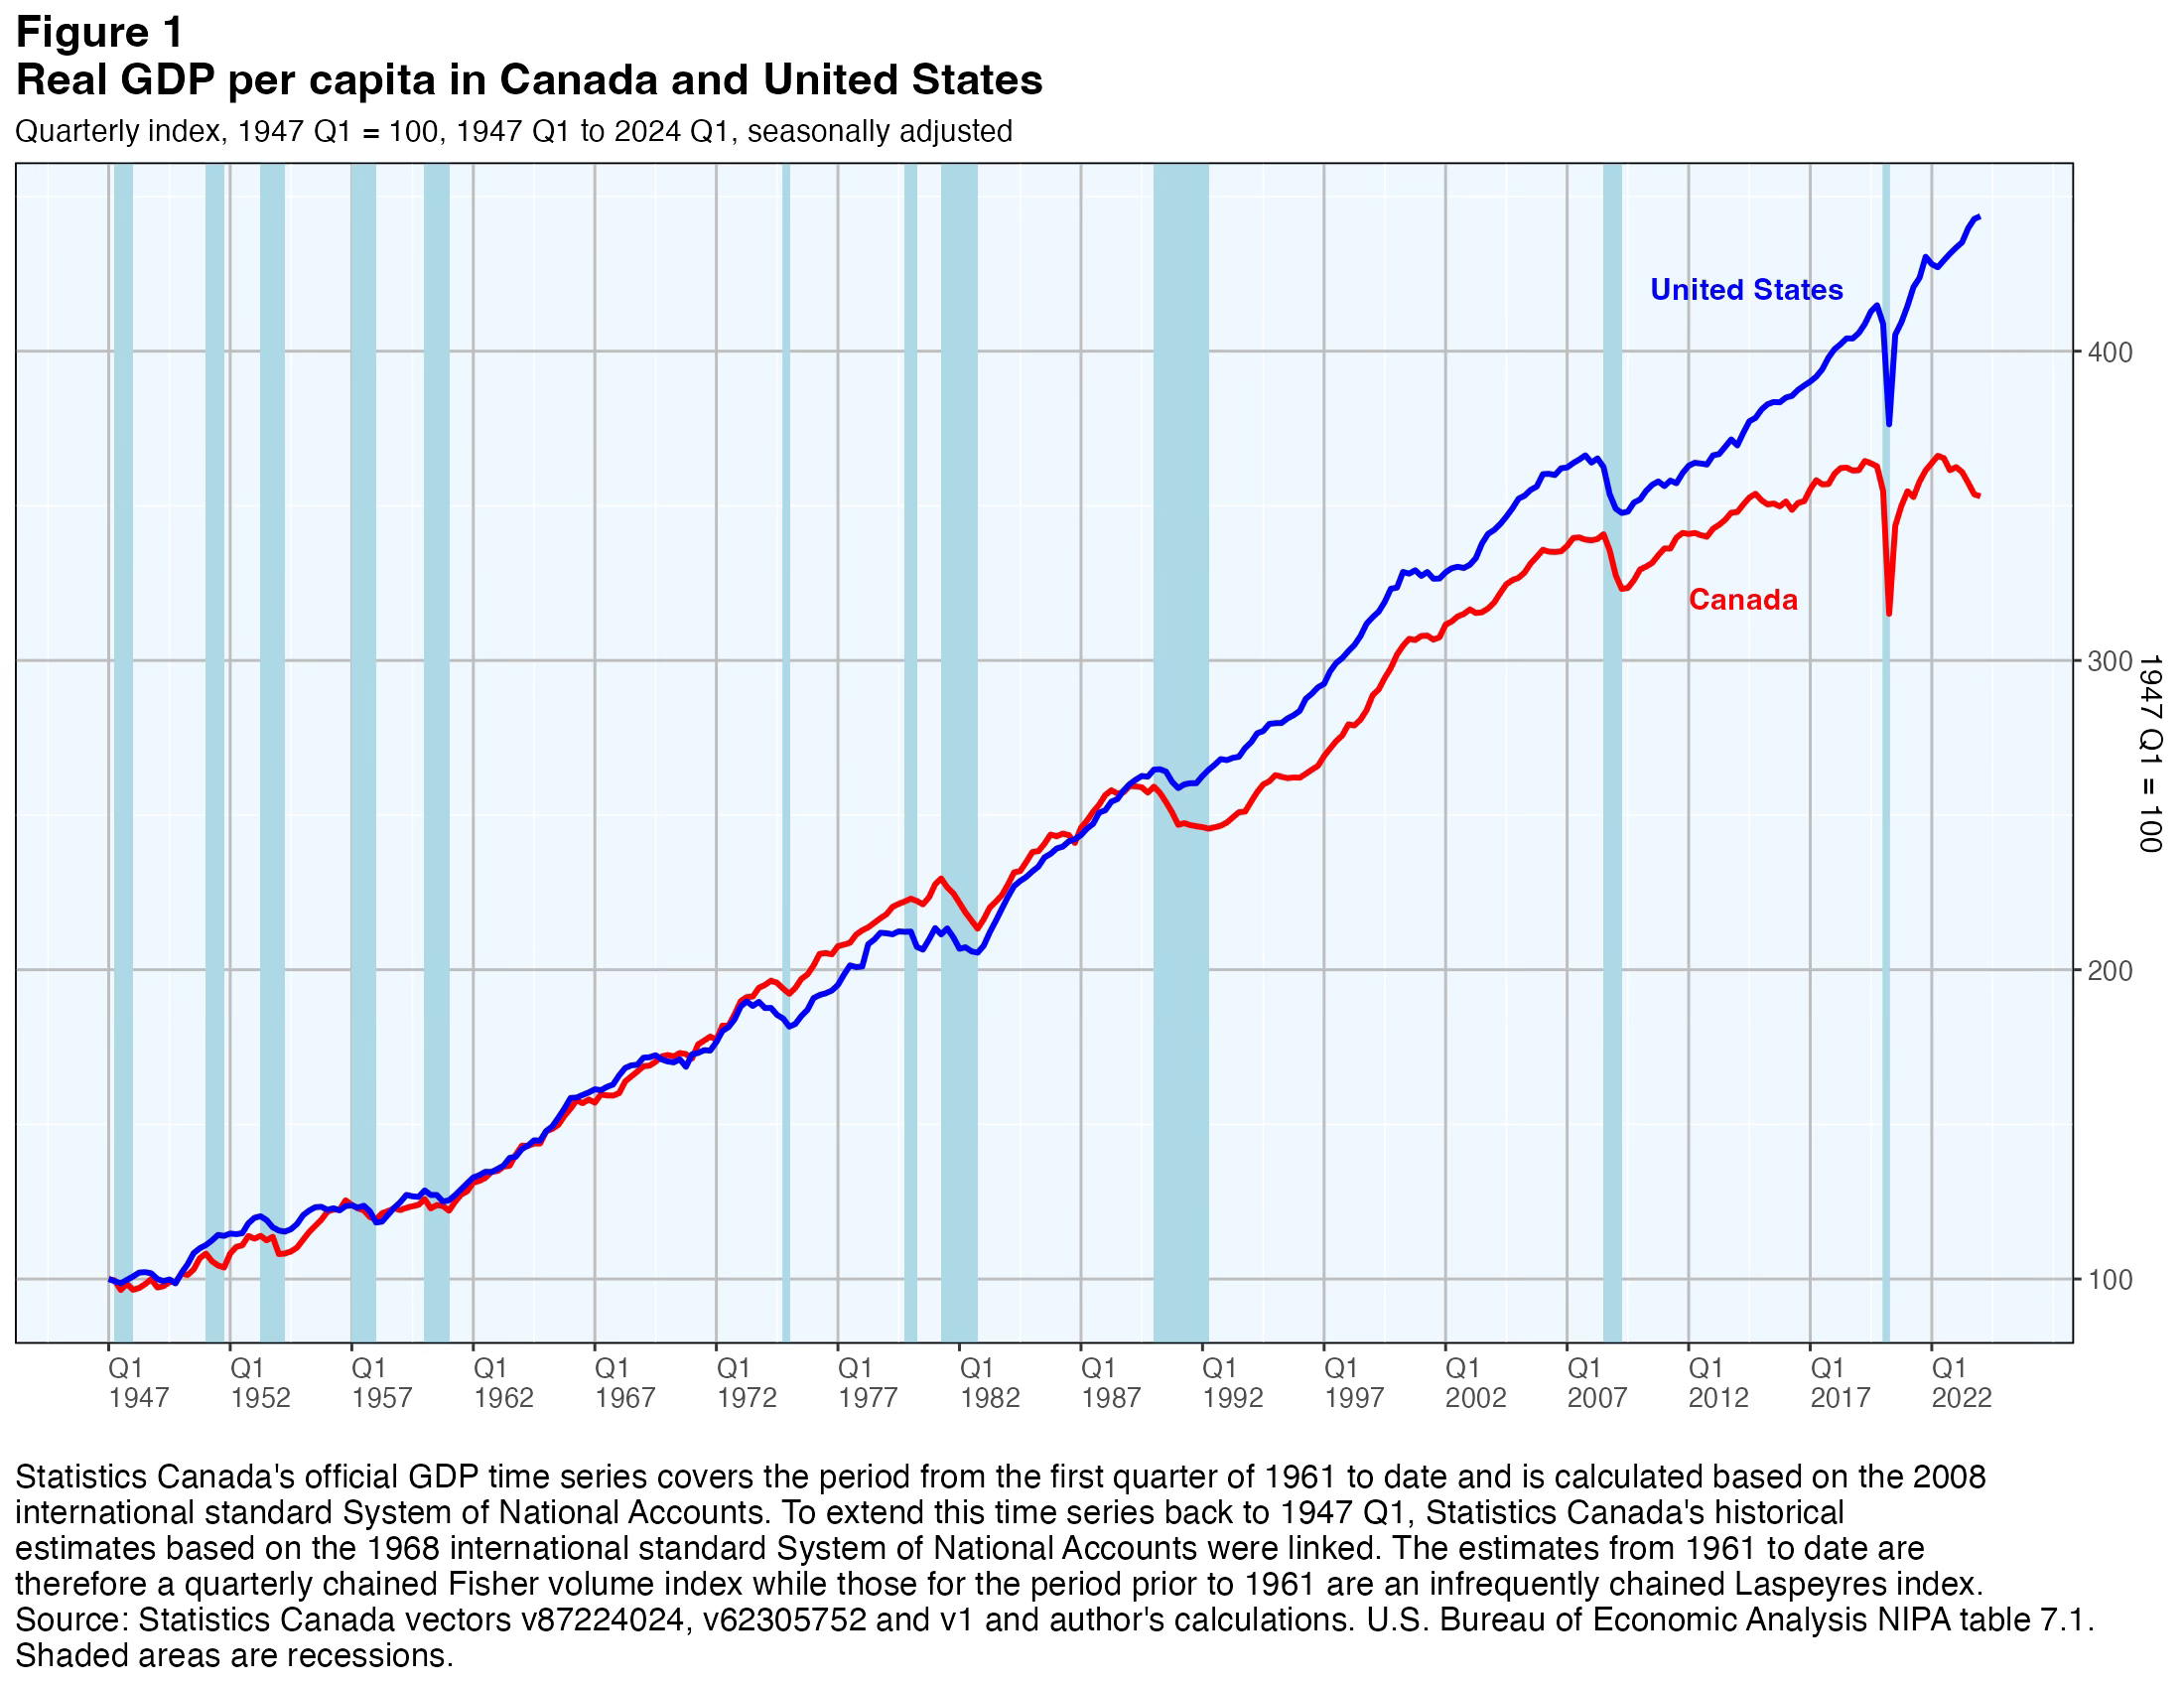
As shown in Figure 1, Canada’s GDP per capita followed the path of its U.S. counterpart fairly closely until the recession of 1990-1992, when it fell behind. It has not closed the resulting gap, but did continue along a path parallel to the U.S. until around 2015 when Canada experienced a mini-recession related to falling world energy prices (evident but not shaded in Figure 1). From that point on, the gap began to widen further and quite considerably as Canada’s productivity growth slowed while U.S. productivity grew more quickly.
The focus of this paper is on the most recent four years shown in the chart, which were impacted by the COVID-19 pandemic and its aftermath. GDP per capita plunged in early 2020 when the economy was put on lockdown, affecting both production and spending as everyone sought to minimize the spread of infection. But the economy rebounded quickly as people and businesses found adjustments that allowed for an opening up of activities while still countering the virus’ spread.
By 2022, real GDP and inflation were surging. Real GDP grew at a 3.9% average annual rate in the first two quarters of that year while the CPI rose at a 9.0% rate on the same basis. Many other countries faced a similar situation. Central banks around the world, including the Bank of Canada, raised interest rates to slow their economies down. Canada’s GDP growth did indeed slow, growing on average at an annual rate of just 0.9 percent in the following seven quarters to 2024 Q1. The labour market, which had attained record low unemployment rates and high job vacancy rates in 2022, has loosened considerably (Figure 2). Unemployment rates edged up slightly in the U.S. as well, but American GDP growth, after also slowing in mid-2022, resumed its extraordinary strength with 2.2 percent average quarterly growth at an annual rate between 2022 Q2 and 2024 Q1.

So why has GDP per capita been falling in Canada for several quarters? Unlike in previous episodes where Canada’s GDP per capita has decreased substantially, this time modest economic growth continues. There is no apparent recession. What explains the difference and what policy action can be taken to turn this declining trend around without at the same time allowing a resurgence of inflation? These are the questions addressed in this paper.
Population growth and non-permanent residents
An unusual aspect of Canada’s economy today, relative to the last 50 years, is the high rate of population growth (Figure 3). Population normally grows at a slow and fairly predictable rate. It increased 1.1 percent a year on average in the half-century from 1972 to 2021 with a standard deviation of 0.2 percent. Since mid-2022, however, it has risen much more rapidly: 2.1 percent in 2022 and 3.2 percent in 2023. This indicates that unlike in the previous postwar episodes where falling GDP explained the drop in GDP per capita, this time unusually rapid population growth is also a factor. The denominator is as much a factor as the numerator in explaining developments this time around.

Why has the population risen so rapidly since mid-2022? It is not because of more rapid birth rates or falling death rates. Nor is it because of substantially higher rates of immigration which, following a pandemic-related decrease to 185 thousand in 2020, were 406 thousand in 2021, 438 thousand in 2022 and 472 thousand in 2023.2 It is, rather, because of a huge inflow of non-permanent residents (NPRs).
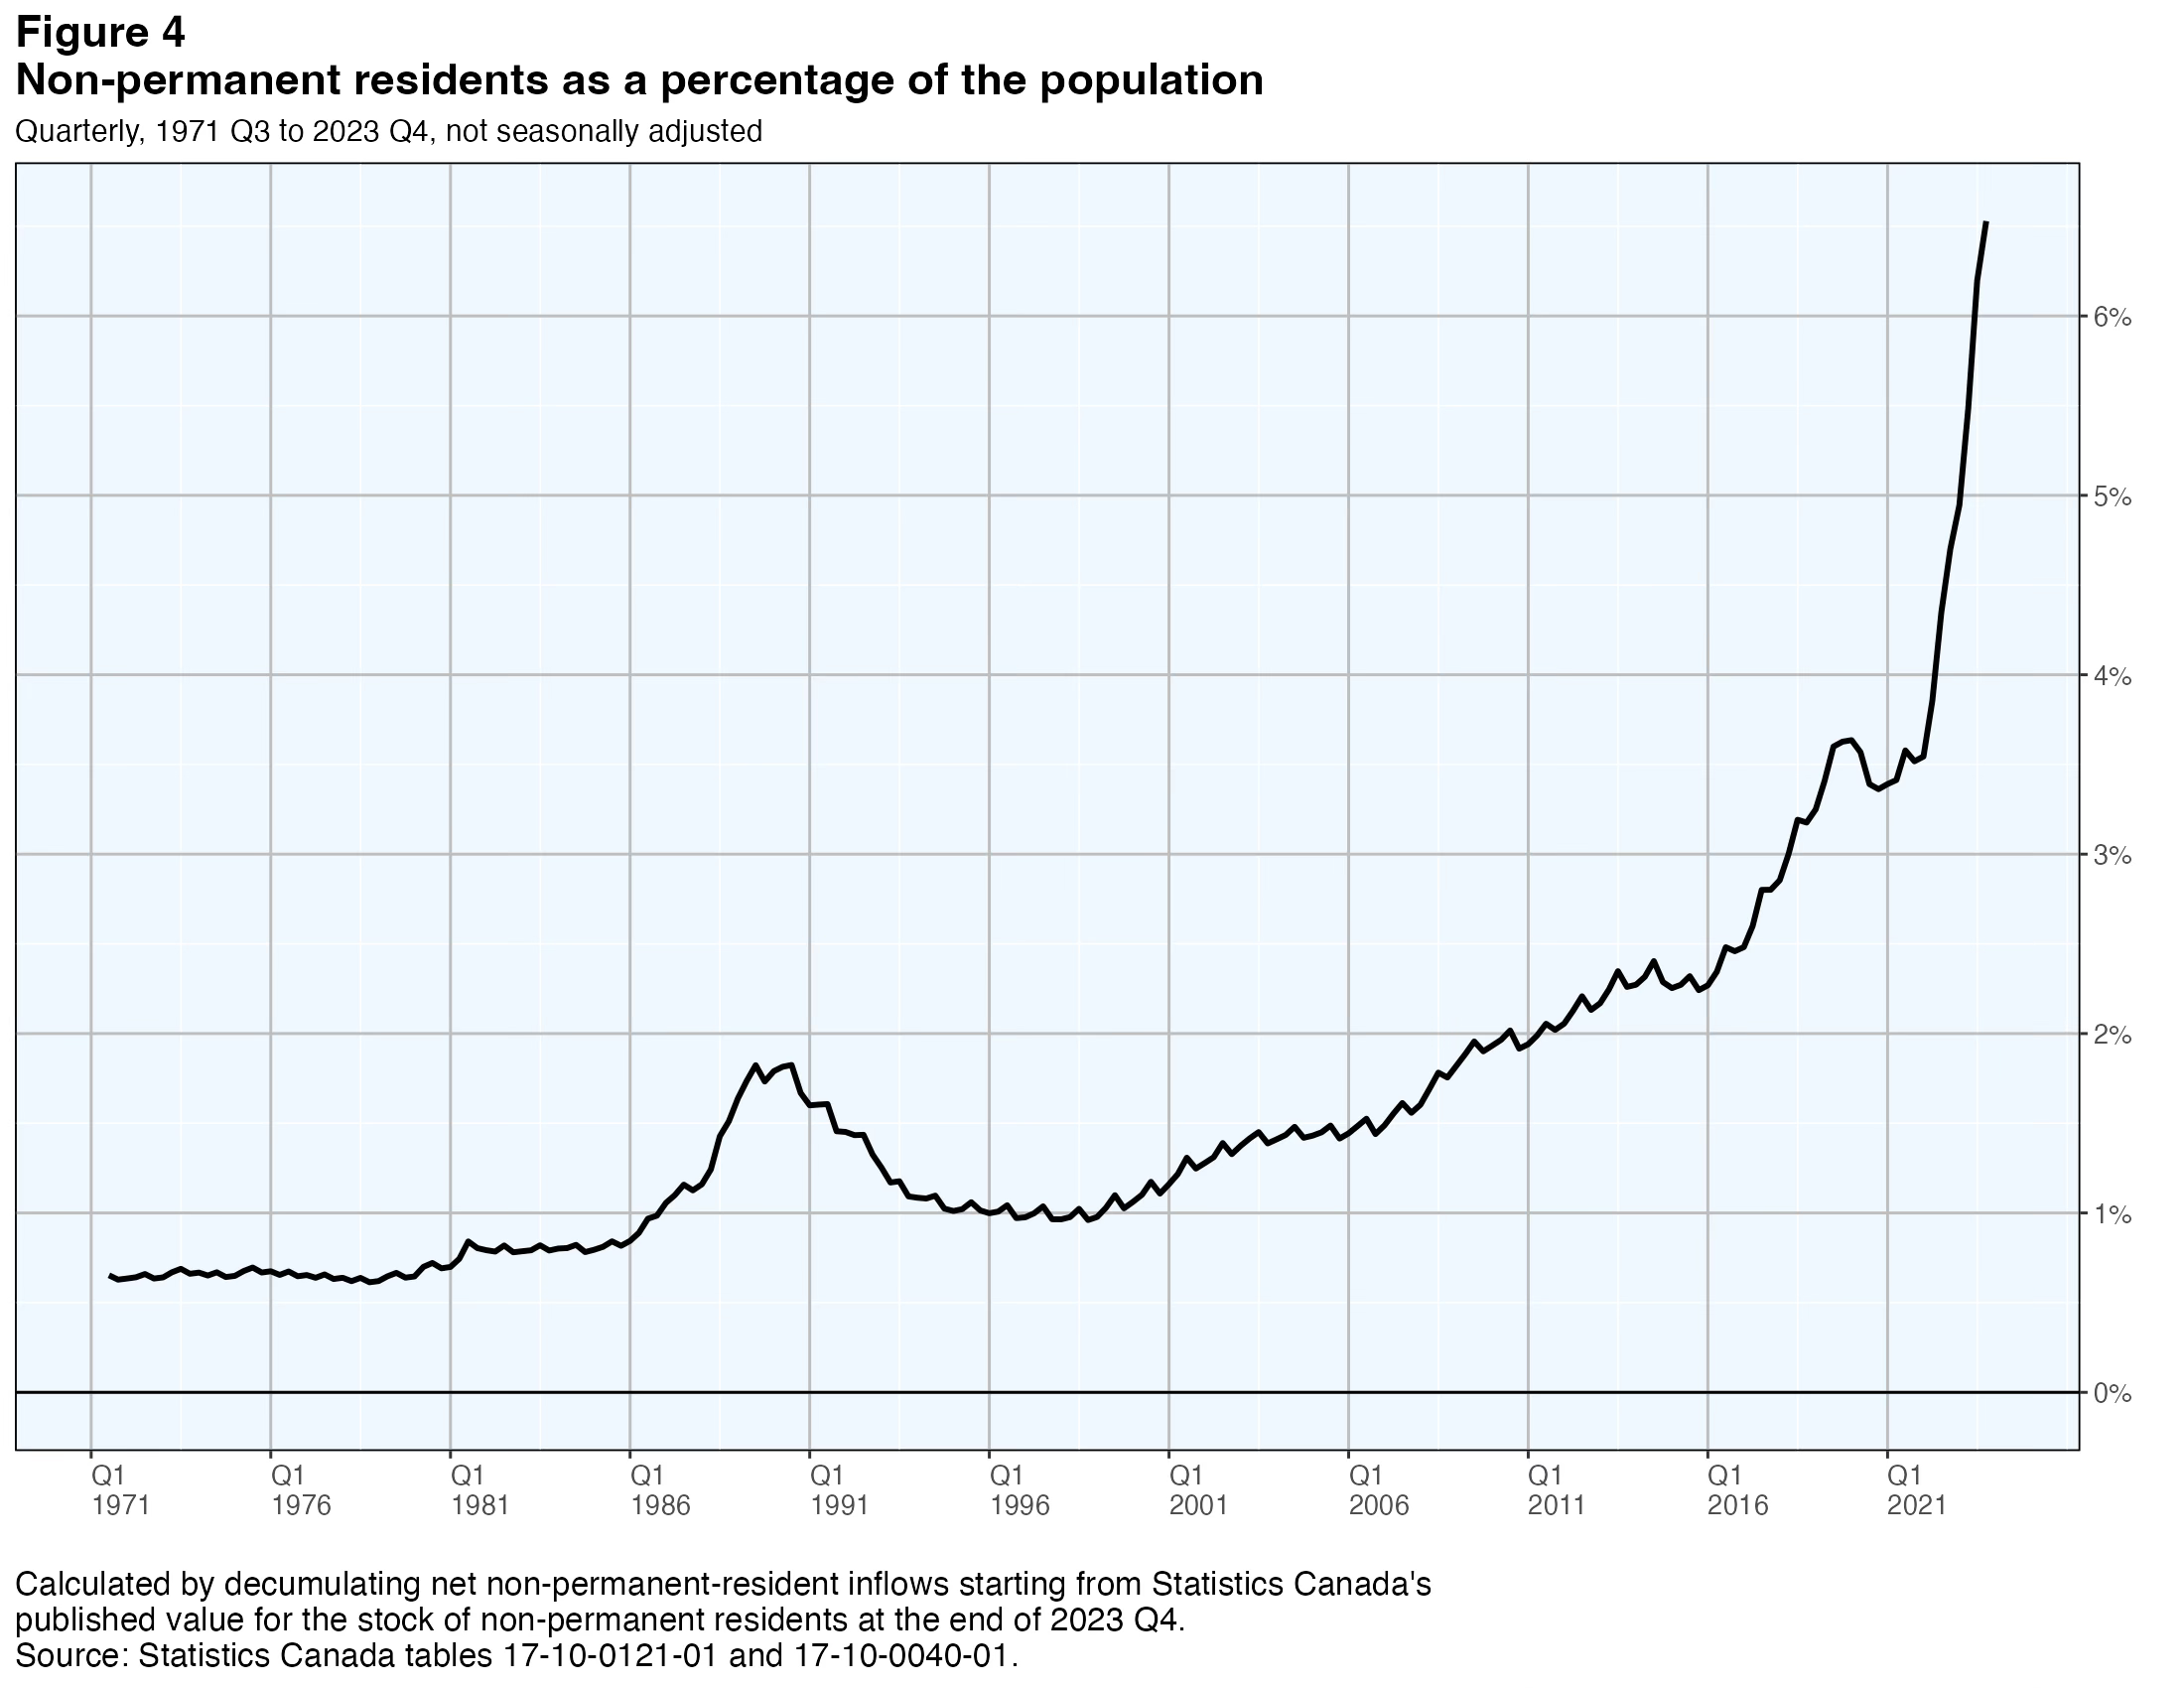
The percentage of NPRs in the Canadian population crept up gradually between 1971 and 2016, rising from under 1 percent to a little over 2 percent (Figure 4). It then rose more quickly from 2016 to 2023, in particular in 2022 and 2023. It climbed by around 3.5 percent per year until it plateaued during pandemic-related restrictions on cross-border travel. In 2022, however, the share of NPRs resumed its upward climb at an even faster pace, bringing the number of non-permanent residents in Canada to 6.5 percent of the population by January 2024, some 2.7 million people. That is a large number, equivalent to more than double the total population in each of five of Canada’s ten provinces.
The composition of Canada’s NPR population has shifted over the last two and a half years (Figure 5). Study permit holders accounted for a substantial share of the increase but the largest share was attributable to temporary work permit holders.
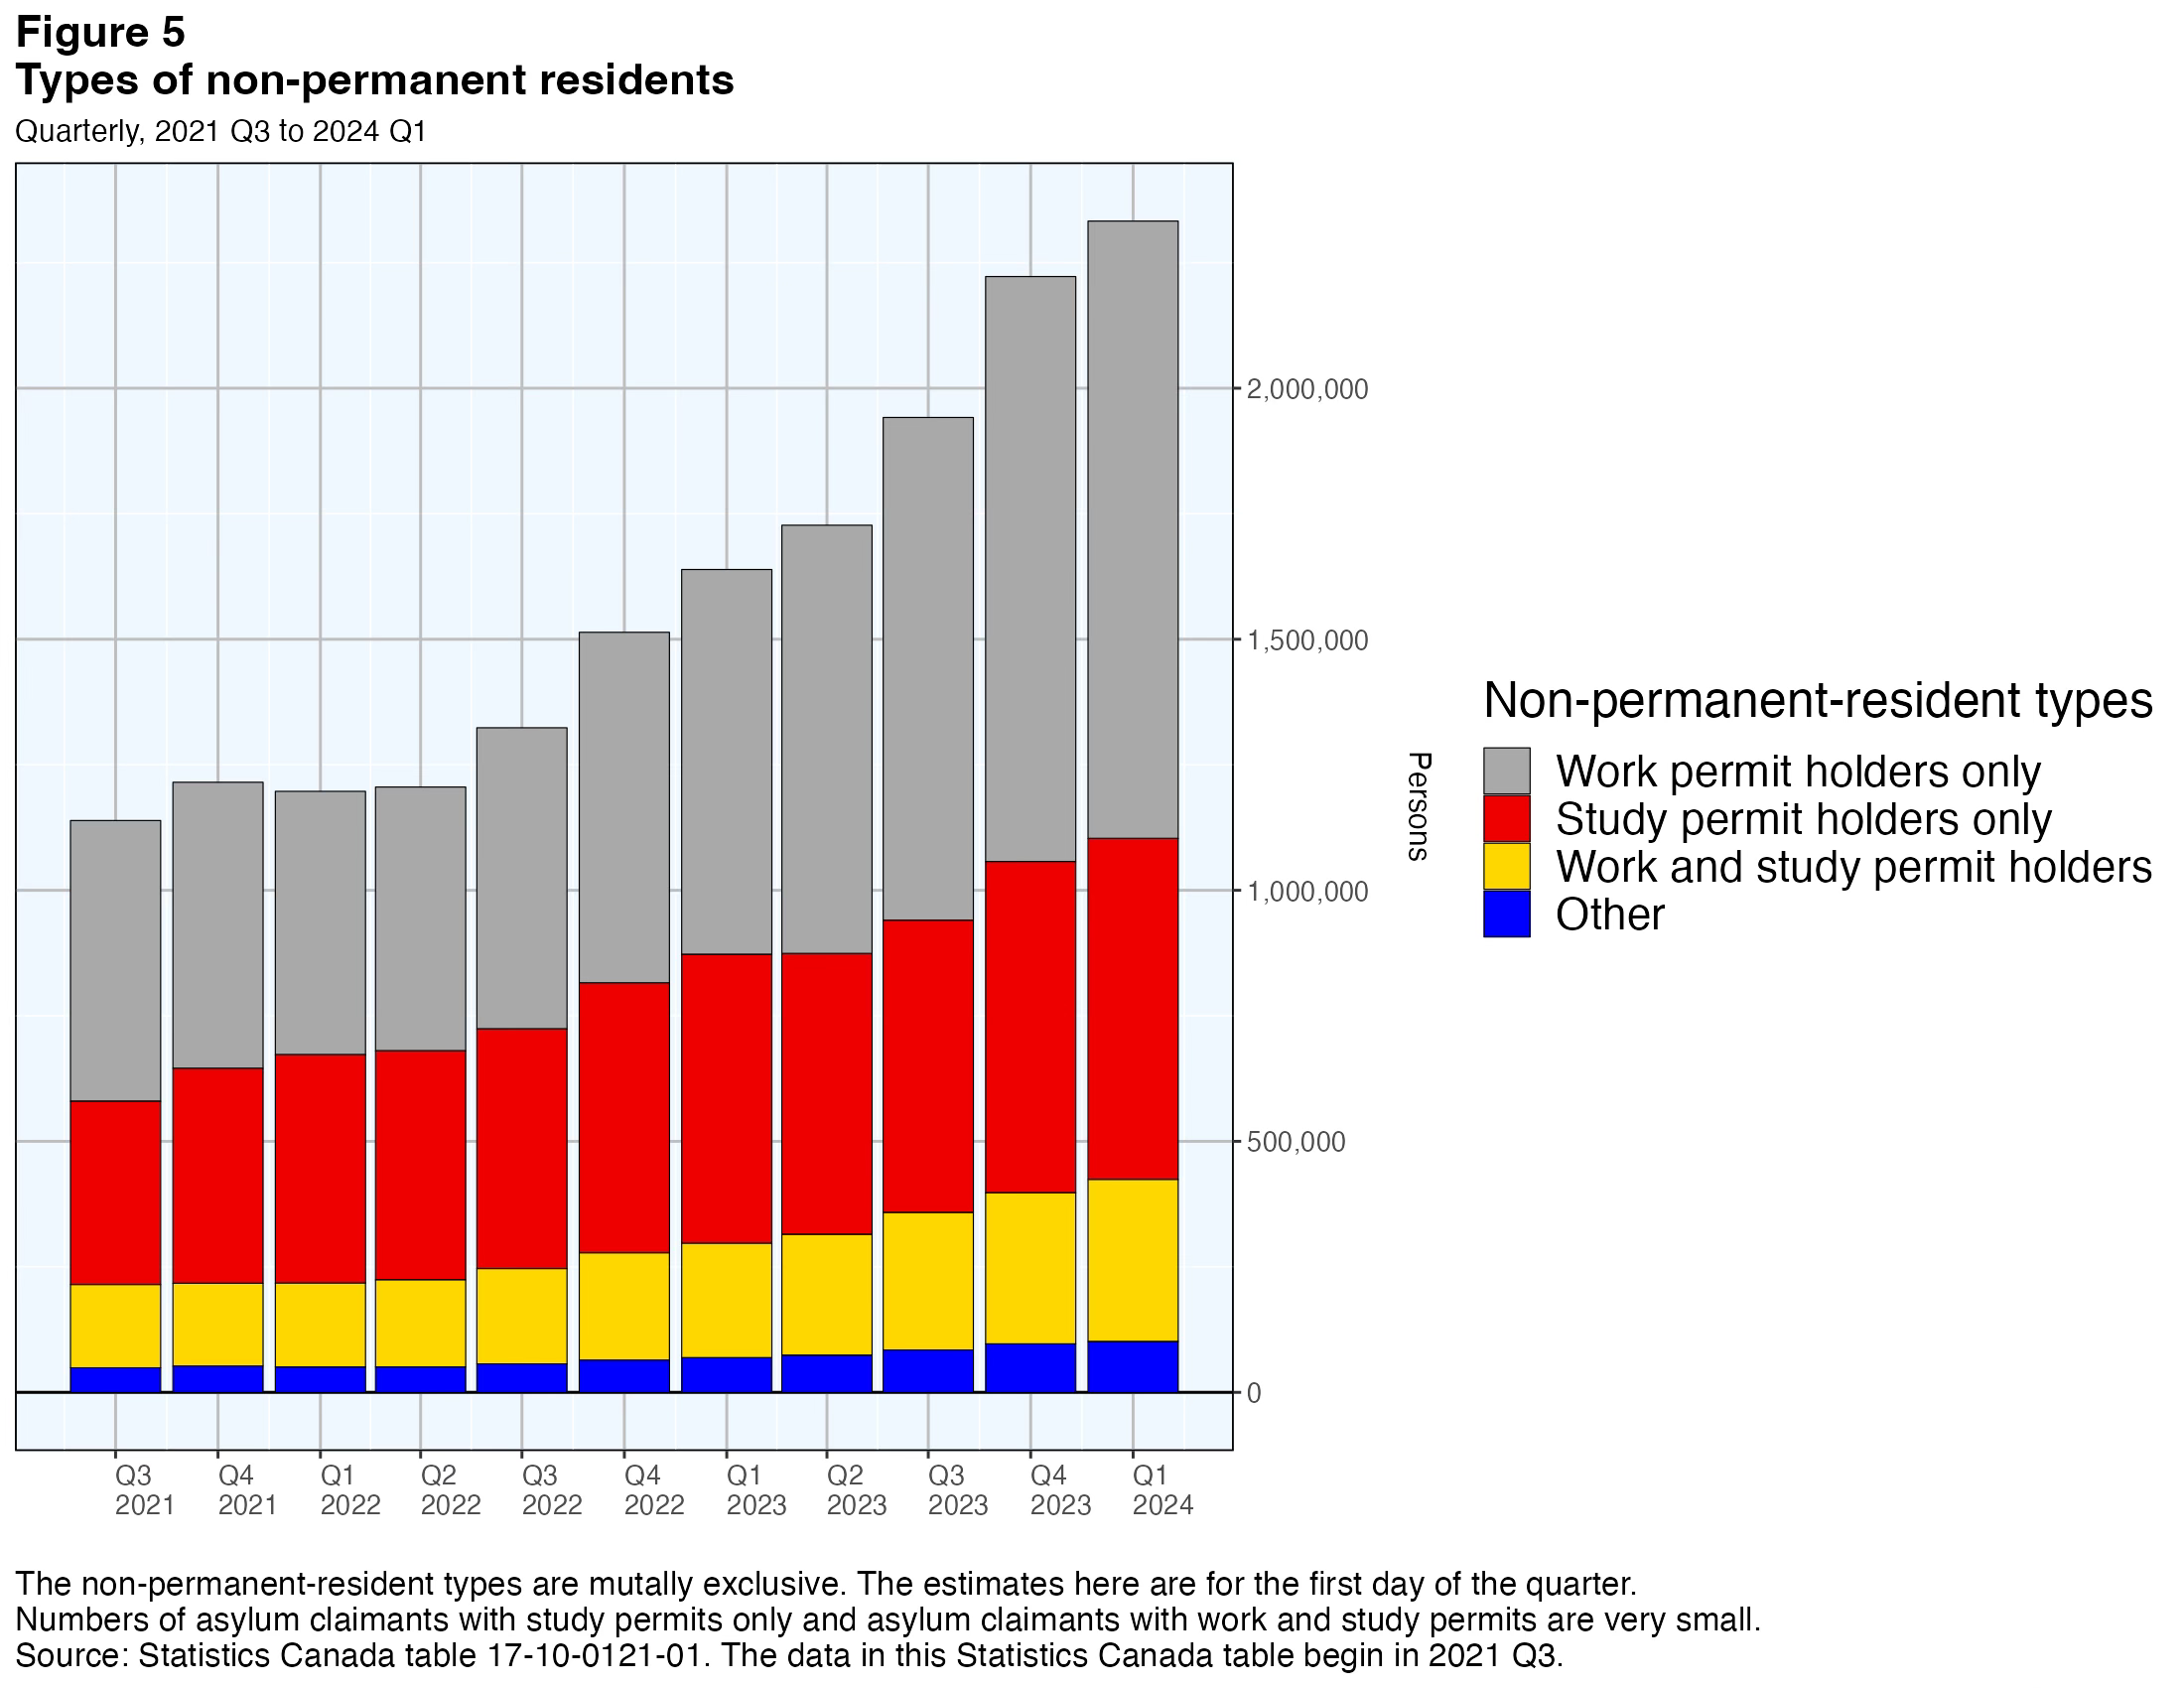
Asylum claimants were 12 percent of NPRs in the most recent quarter and 60 percent of them had work permits. Aside from asylum claimants, students accounted for 38 percent of NPRs and about a third of them had work permits (as well as study permits). People with work permits only (who were neither asylum claimants nor students) accounted for 46 percent of NPRs and the remainder were family members and special cases, mostly without work permits. All told, about 65 percent of NPRs had some kind of work permit, although based on census data for 2021, their labour force participation rate was substantially lower than 100 percent (Tuey and Bastien 2023).3
The key question then is: What contribution to GDP is being made by the NPRs? If the recent influx of NPRs is causing the population to grow by 3.2 percent a year instead of the 1.1 percent or so seen in prior years, why is GDP growth not keeping up with this jump in population?
This is a question that cannot be answered with precision. We simply do not, at present, have the detailed statistical information about NPRs and their role in the economy that would permit a definitive analysis. But we have sufficient information to surmise their contribution to GDP is substantially less than that of the rest of the population (Canadian-born residents and immigrants).
Last year Statistics Canada released a study of the socio-economic characteristics of the NPR population using data for 2020 drawn from the 2021 Census of Population (Tuey and Bastien 2023). NPRs were found to be younger on average than the PR population. Of those who had jobs, more worked part-time and those who worked full-time in many cases worked less than a full year since some work permits have hours-per-week limitations and are for fixed-length work periods.4 According to the study, 92 percent resided in census metropolitan areas and 60 percent lived in Ontario or British Columbia.
Unfortunately, the Statistics Canada study contains no information about the earnings of NPRs. However, it does reveal the top ten occupations for NPRs were low-wage occupations. They are:
Nurse aides, orderlies and patient service associates;
Light duty cleaners;
Material handlers;
Labourers in food and beverage processing;
Transport truck drivers;
Food counter attendants, kitchen helpers and related support occupations;
Delivery service drivers and door-to-door distributors;
Retail salespersons and visual merchandisers;
Security guards and related security service occupations; and
Other customer and information services representatives.
The information in the Statistics Canada study implies the overall impact of NPRs on GDP per capita is quite different from that of Canada’s PRs. Their average productivity is likely significantly lower because they tend to work primarily in occupations paying relatively low wages per hour worked. In addition, it seems they tend to work fewer hours per annum than PRs. The per capita GDP contribution of NPRs looks to be substantially smaller than that of PRs.
The relevance of the findings from the Statistics Canada study for what occurred in 2022 and 2023 must be qualified though, because it was based on census data for the pandemic year 2020. The results may be less applicable to the post-pandemic years 2022 and 2023 when the number of NPRs was so much bigger and when some important government policies vis-a-vis NPRs had changed.
Within the Temporary Foreign Worker Program, the federal government, in April 2022, increased the cap on the proportion of low-wage temporary foreign workers businesses could hire from 10 percent to 20 percent for all low-wage employers. Moreover, for low-wage employers in certain specific sectors it raised the cap to 30 percent. These measures were in response to calls from businesses saying they were experiencing unskilled labour shortages (Employment and Social Development Canada, 2022 and 2023).
The government also adjusted its policies within the International Student Program. In 2022, it announced a number of measures intended to address the perceived shortage of unskilled labour, including extensions of the time period during which foreign students could remain in Canada after graduation and the temporary lifting of the 20-hour-per-week cap on the number of hours that eligible post-secondary students are allowed to work off-campus while class is in session (Immigration, Refugees and Citizenship Canada, 2022).
The unskilled labour shortage proved short-lived as the job vacancy rate began to drop in mid-2022 and the unemployment rate started moving up (Figure 2). In late 2023 and early 2024, the government took steps to unwind the policy changes relating to foreign student visas. In March it announced it would also cut back on the number of temporary foreign workers allowed in Canada and would do so gradually, over a three year period, aiming for an NPR-to-population ratio of 5% by the end of 2026 (Immigration, Refugees and Citizenship Canada, 2024).
How NPRs affect GDP and GDP per capita
Working-age population growth can be expected to increase real GDP, though by how much will depend on the composition of those people, notably the education and skill mix. It will also be affected by the extent to which that mix corresponds with the needs of Canadian employers. The 2021 census study stated that in 2020, NPRs were generally employed in jobs demanding education and skills below those they actually possessed (Tuey and Bastien, 2023). We cannot know what real GDP growth would have looked like in 2022 and 2023 if there had been no NPR surge in those years, but it would probably have been weaker, especially in 2023. A rough ‘back of the envelope’ calculation, assuming a constant NPR employment rate of 65 percent and average earnings of $25,0005 per NPR, indicates total NPR earnings rose from about $21 billion in 2021 to $24 billion in 2022 and $35 billion in 2023. An $11 billion differential impact on GDP growth in 2023 would have been equivalent to just under 0.4 percent of GDP. Statistics Canada reports an actual growth rate in that year of 1.5 percent, so the rough estimate implies it would have been closer to 1 percent without the NPR surge.
However, during the same period, real GDP per capita declined almost 2 percent. This is because the relative increase in population greatly exceeded its relative impact on GDP.
GDP per capita can be regarded as the population-weighted average of per capita production attributable to PRs and NPRs. As just mentioned, there are reasons to believe the latter is smaller than the former. As the weight of NPRs in the total population rose from around 3.5 percent in 2020-2021 to 6.5 percent by the end of 2023, this exerted a downward pull on the overall GDP-to-population ratio. There are, of course, other factors affecting GDP per capita in addition to the size and composition of the population. We explore these next.
Accounting for changes in real GDP per capita
This study uses a multiplicative decomposition method to investigate the impact of factors affecting GDP per capita, in which real GDP per capita is defined to be the product of six important drivers, as follows:
GDP/N = GDPb/Hb * Hb/Jb * Jb/Nw * Nw/Np * Np/N * GDP/GDPb (1)
where:
GDP = real total gross domestic product;
N = total population;
GDPb = real business sector gross domestic product;
Hb = total hours worked in the business sector;
Jb = number of jobs in the business sector;
Nw = working-age population;
Np = permanent-resident population.
This decomposition framework is used below to analyze recent developments, using quarterly statistics.6 The factors in equation (1) are measured using indexes scaled so the calendar average in 2017 = 100. This is also the practice followed by Statistics Canada in its table 36-10-0206-01, from which some of these time series are drawn.
The analysis is focused on the first difference of the logarithm of real GDP per capita, which implies an additive rather than a multiplicative relationship as in equation (2):
Δln(GDP/N) = Δln(GDPb/Hb) + Δln(Hb/Jb) + Δln(Jb/Nw)
+ Δln(Nw/Np) + Δln(Np/N) + Δln(GDP/GDPb) (2)
To a close approximation, the first difference of the logarithm, when multiplied by 100, is equal to the percentage change when the relative changes are small.
The decomposition starts from the fact that GDP per capita is a ratio, with GDP in the numerator and population in the denominator. This ratio can be expressed as a product of other ratios that are thought to be important in explaining changes in GDP per capita, with the proviso that the numerators of the additional ratios must be the same as the denominators in other ratios, so they cancel out.
Empirically, as will be discussed further below, the most important driver is business sector labour productivity,7 which dominates the others over the long run. The other five macroeconomic drivers considered in this paper, while they have been important over relatively short periods of time, in specific circumstances, have not changed greatly over longer stretches of time. Productivity, however, has trended up strongly over the long run, increasing more than three-fold since the second world war. The pace and composition of non-human capital formation, human capital upgrading, knowledge accumulation and technical change all help explain growth in labour productivity over time and have an outsized effect on GDP per capita.
Why the emphasis on labour productivity in the business sector rather than for the total economy? Simply because we have no good way to measure the productivity of the non-business sector. Its output is not sold in the market and, therefore, does not have a well-defined value. We know what it costs, but not what it is worth. Labour productivity change is essentially zero by definition in the non-business sector because Statistics Canada and most other national statistical agencies adopt the convention of defining the value of its output as the value of its inputs, even though productivity change in the sector is not truly zero.
One of the other factors that can have an influence, though typically over shorter periods of time, is average hours worked per business job. If the working population works longer or shorter hours, this will have a corresponding impact on real GDP per capita. But unlike labour productivity, which has proven over a long period of time to trend upward indefinitely, there are limits on the average number of hours employees can work in a given time period. Short-term fluctuations in average hours worked per job can sometimes affect GDP per capita significantly as they did, for example, in the early months of the COVID-19 pandemic, but they are unlikely to be a consistent driving force over an extended period.
Another factor is the number of business jobs expressed as a ratio to the working-age population.8 This driver is similar to the previous factor, but rather than focusing on the amount of work done in the average job it focuses on the number of jobs themselves, as a ratio to all available people of working age. Occasionally this ratio can trend up or down over an extended period, as it did gradually during the second half of the twentieth century as more and more women entered the labour force. But as with average hours worked per business job, there are limits to the percentage of the working-age population that can work. In the twenty-first century this driver is characterized mostly by short-term fluctuations, notably those associated with the business cycle.
Another component of the decomposition is the ratio of the working-age population to the permanent-resident population. The working-age population is defined here as the number of Canadian residents between 15 and 64 years of age as estimated in the Labour Force Survey. Until recently this large cohort had been declining significantly relative to the total permanent resident population due to the ongoing retirement of the post-war baby boom cohort. However, the huge increase in the NPR population in the last two years, consisting mostly of people of working age, has raised the numerator and reversed that trend for the time being.
The next factor influencing GDP per capita is the ratio of the permanent resident population (citizens and immigrants) to the total population. This ratio had been very high and trending down only mildly for many years, but starting around 2016 and especially after 2021 it has been decreasing more rapidly. (This, of course, is the counterpart to the rise in the NPR share seen in Figure 4). The drop in this ratio has an important impact on GDP per capita because as noted previously there are strong reasons to believe the average real GDP associated with a typical PR is considerably greater than that of a typical NPR.9
Finally, the remaining driver of GDP per capita in this decomposition is the ratio of all-economy GDP to business-sector GDP. The gap between the two consists of three parts: government sector value added, non-profit sector value added and imputed rents on owner-occupied dwellings.10 While, as alluded to earlier, these are excluded from the productivity concept considered in this analysis, they nevertheless are included in total GDP which, after dividing by the total population, is the variable that is in focus in this paper. To the extent these non-business-sector elements are growing more or less rapidly than business sector GDP, total GDP per capita will also tend to grow at a higher or lower rate than would otherwise be the case. For example, all of these non-business-sector components except for non-profit institutions kept growing during the recession of 2008-2009 while business sector output decreased and was slow to recover in 2009 and 2010. Thus, the ratio of total to business-sector GDP increased in late 2008 and early 2009. It remained fairly stable around this higher level until the pandemic struck in 2020. After the extreme volatility in the first half of 2020, the ratio moved again to a higher level. In the four years since the pandemic began in March 2020, total real GDP rose 3.8 percent, business sector GDP 2.8 percent, public administration GDP 8.3 percent, health and social welfare GDP 7.9 percent, education GDP 6.4 percent, non-profit institutions GDP 7.3 percent and imputed rent 9.0 percent. In other words, one might say that the growth of total real GDP per capita has been somewhat ‘propped up’ since the pandemic began with disproportionately strong growth in the non-business sector.
Statistical results
The decomposition analysis described above shows that the six investigated variables have followed different paths over time (Figure 6). The vertical axis scale is the same on all six charts and it is the slope of each line that indicates how large its effect is on GDP per capita, in both the short and the longer-term. Labour productivity’s relative change over the 26-year period has been much greater than the others and it is clearly the main driver of GDP per capita in the long run. It has been on a decline for the last few years though, and has hardly changed at all, on a net basis, since 2017.11
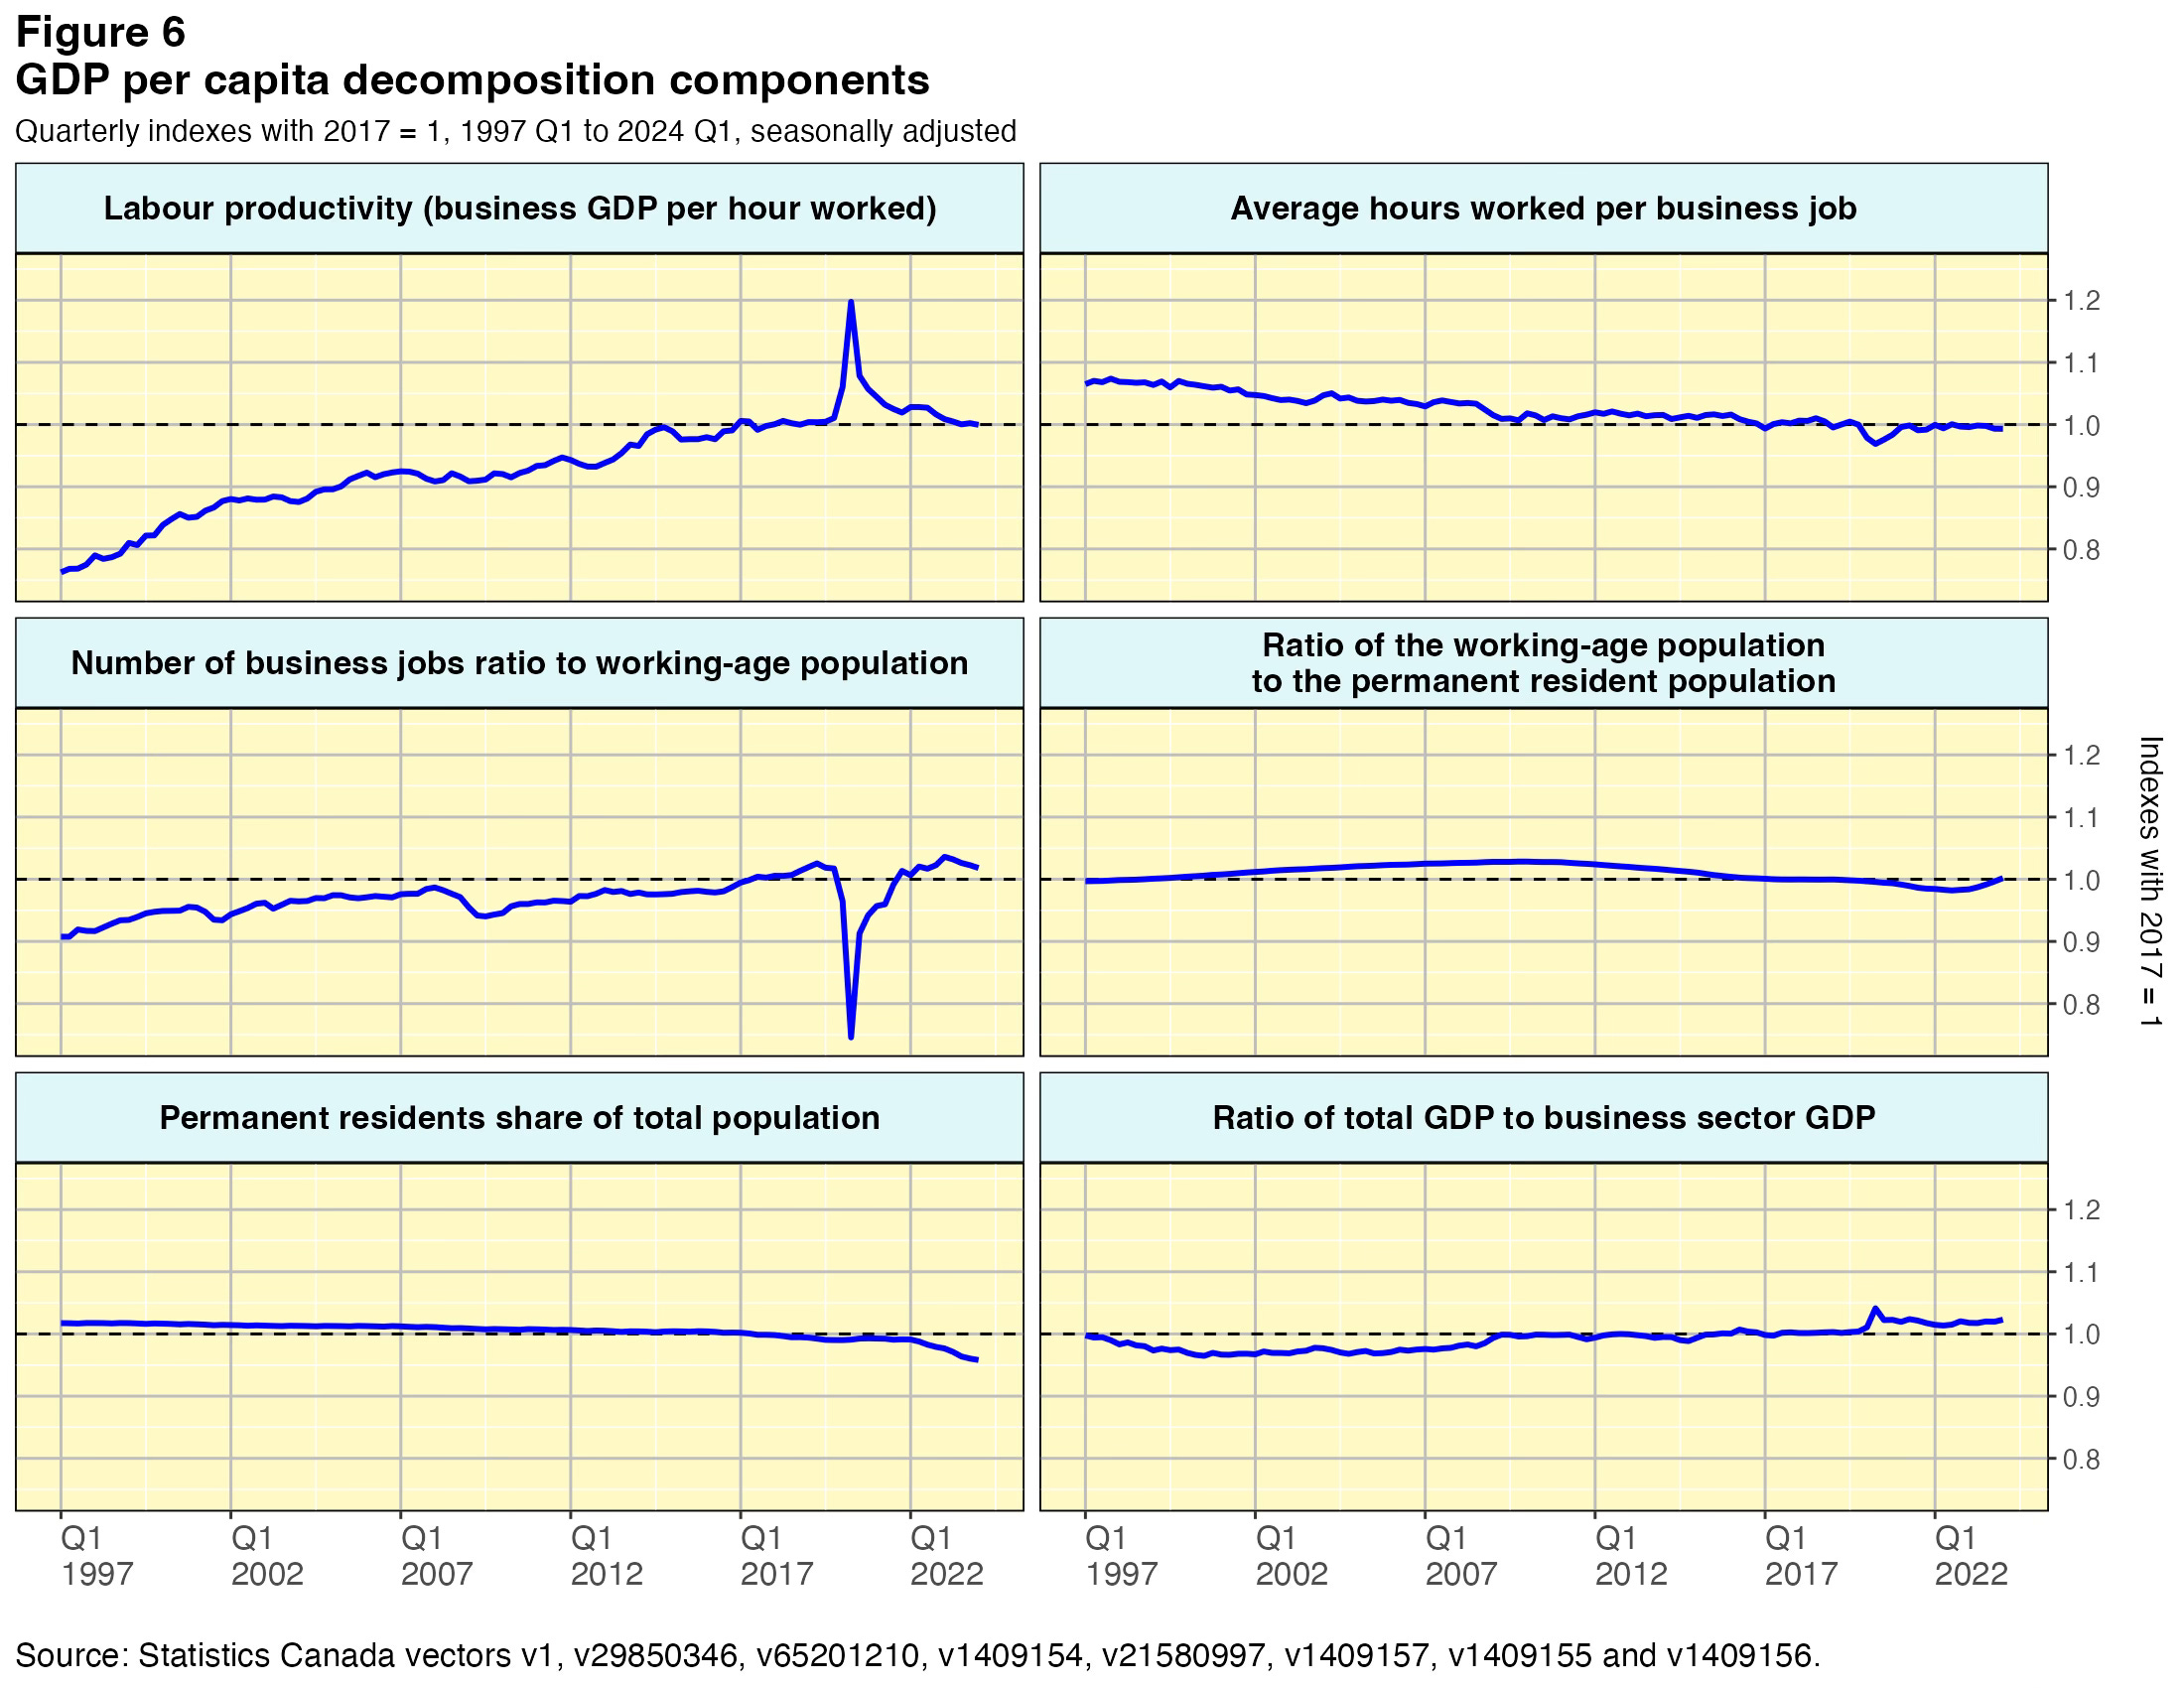
Average hours worked per job have been on a gradual trend decline over the full period, though they have been fairly stable in the years following the pandemic. The number of business jobs relative to the total working-age population (the employment rate) plunged when the pandemic began but recovered quite quickly thereafter and is now past its previous peak. The ratio of the working-age population to the permanent resident population started trending down around 2010 and continued doing so until 2022 when the surge of NPRs, the majority of whom are of working age, began. The number of permanent residents expressed as a ratio to the total population had been trending down gradually until recently. The numbers for 2022 and 2023 show a much sharper drop, due to the recent jump in the number of NPRs. Finally, since non-business economic activity has been growing more rapidly than business activity in the years since the pandemic, the ratio of total to business sector real GDP has increased.
Tracking the drivers of real GDP per capita
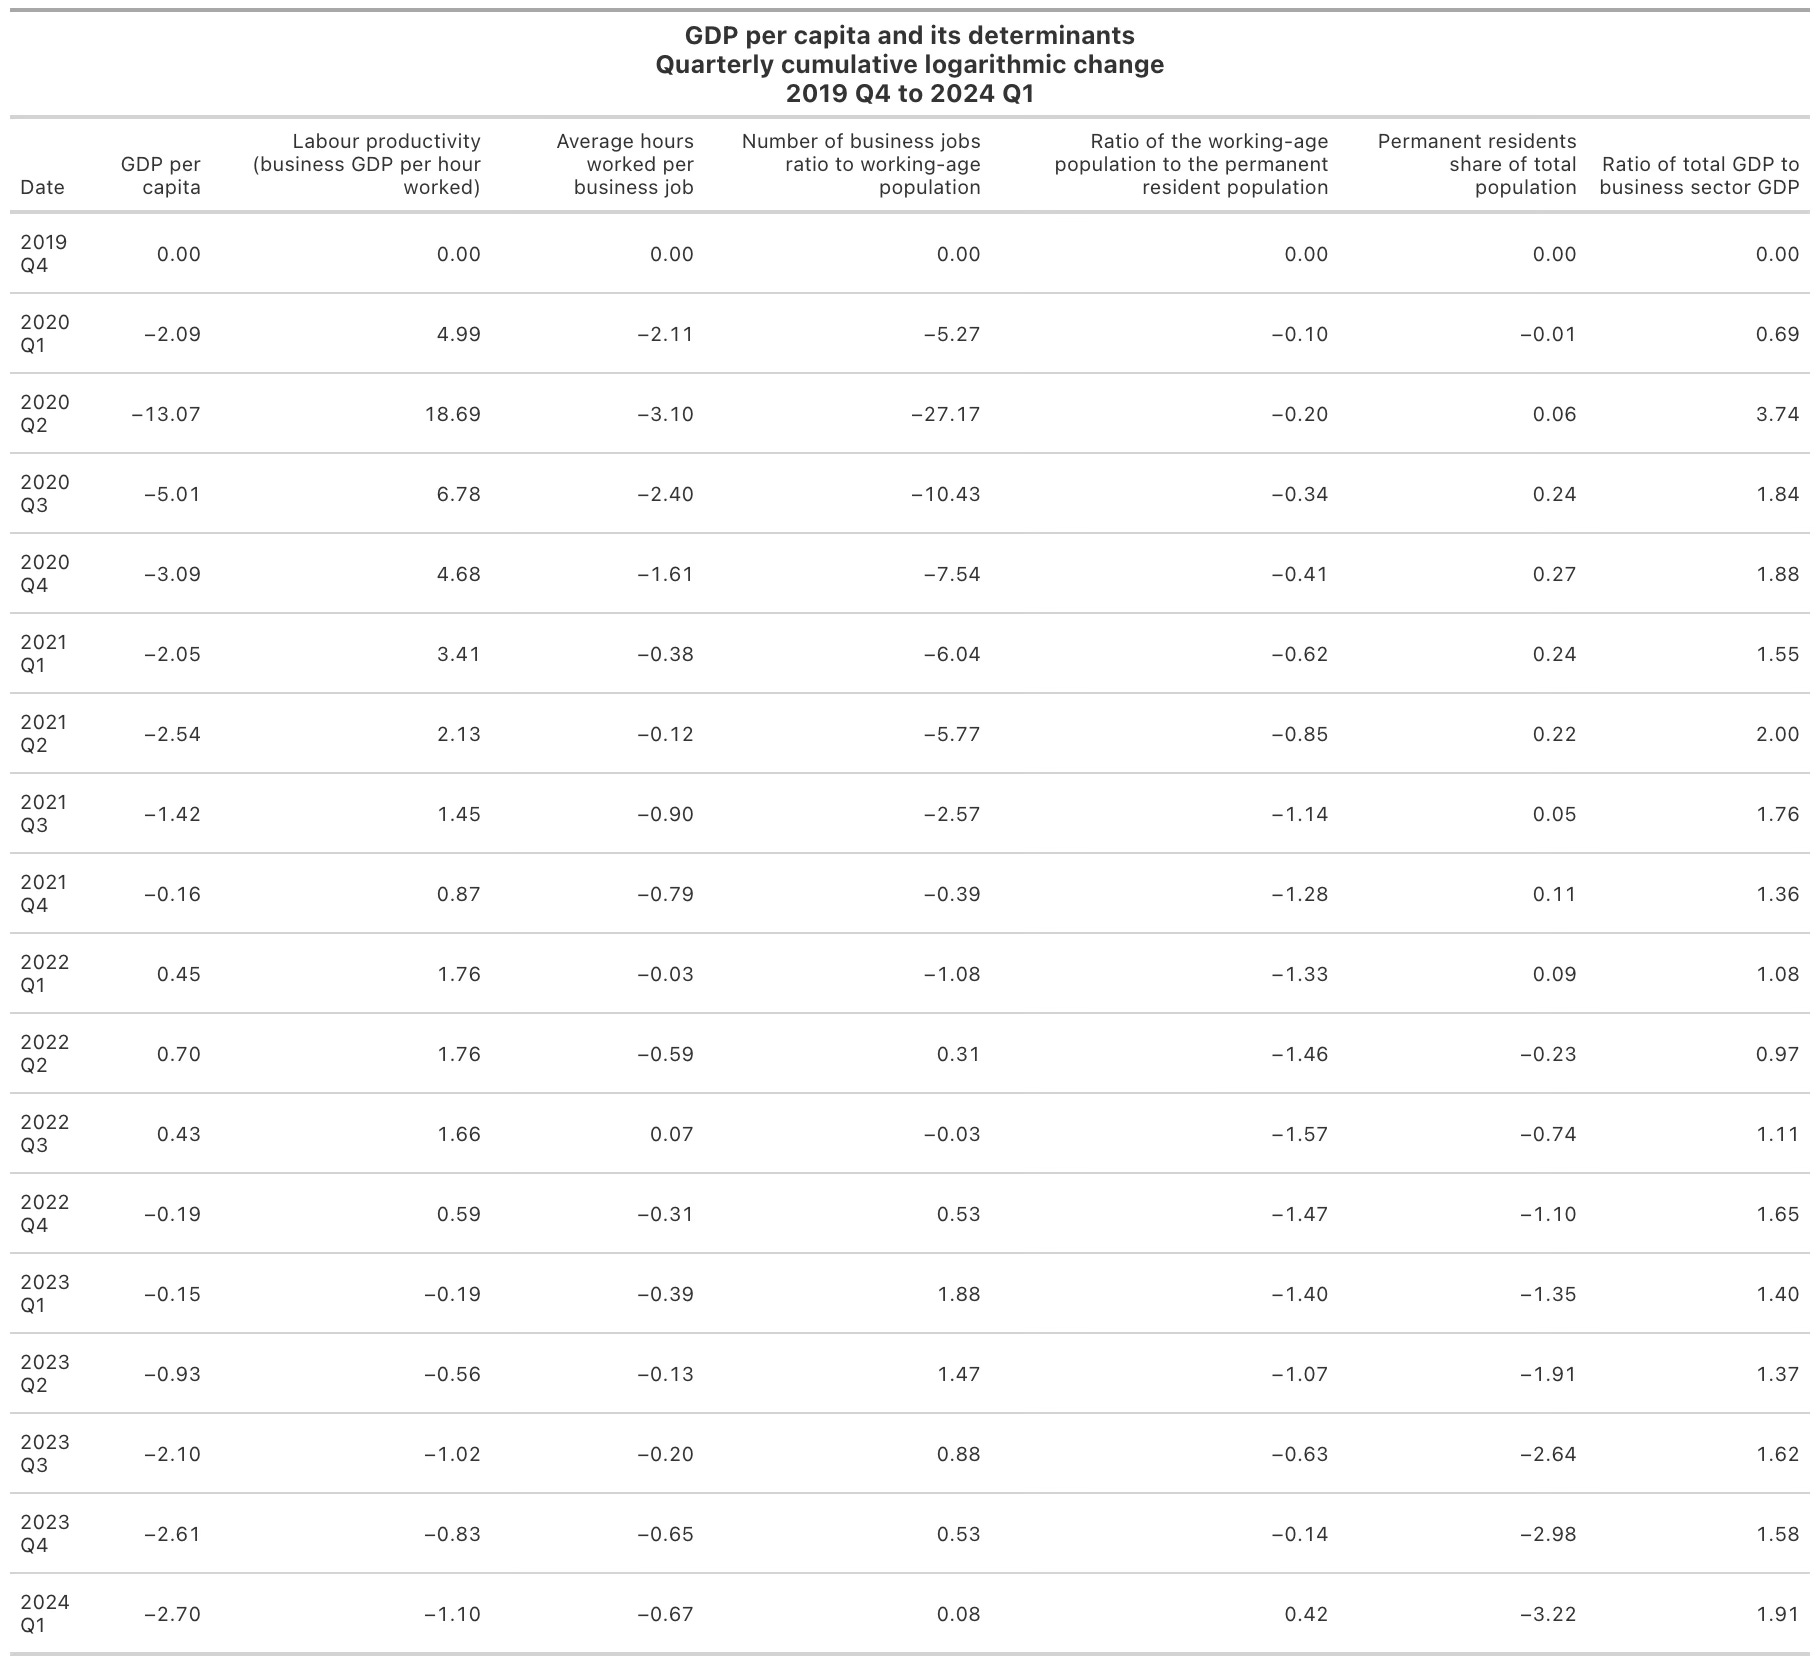
The cumulative change in the real-GDP-to-population ratio since the fourth quarter of 2019 followed a down, up and then down again path over the last four years. Figure 7 decomposes these changes into our factors of interest and the statistics shown in the figure are reported in an annex..12
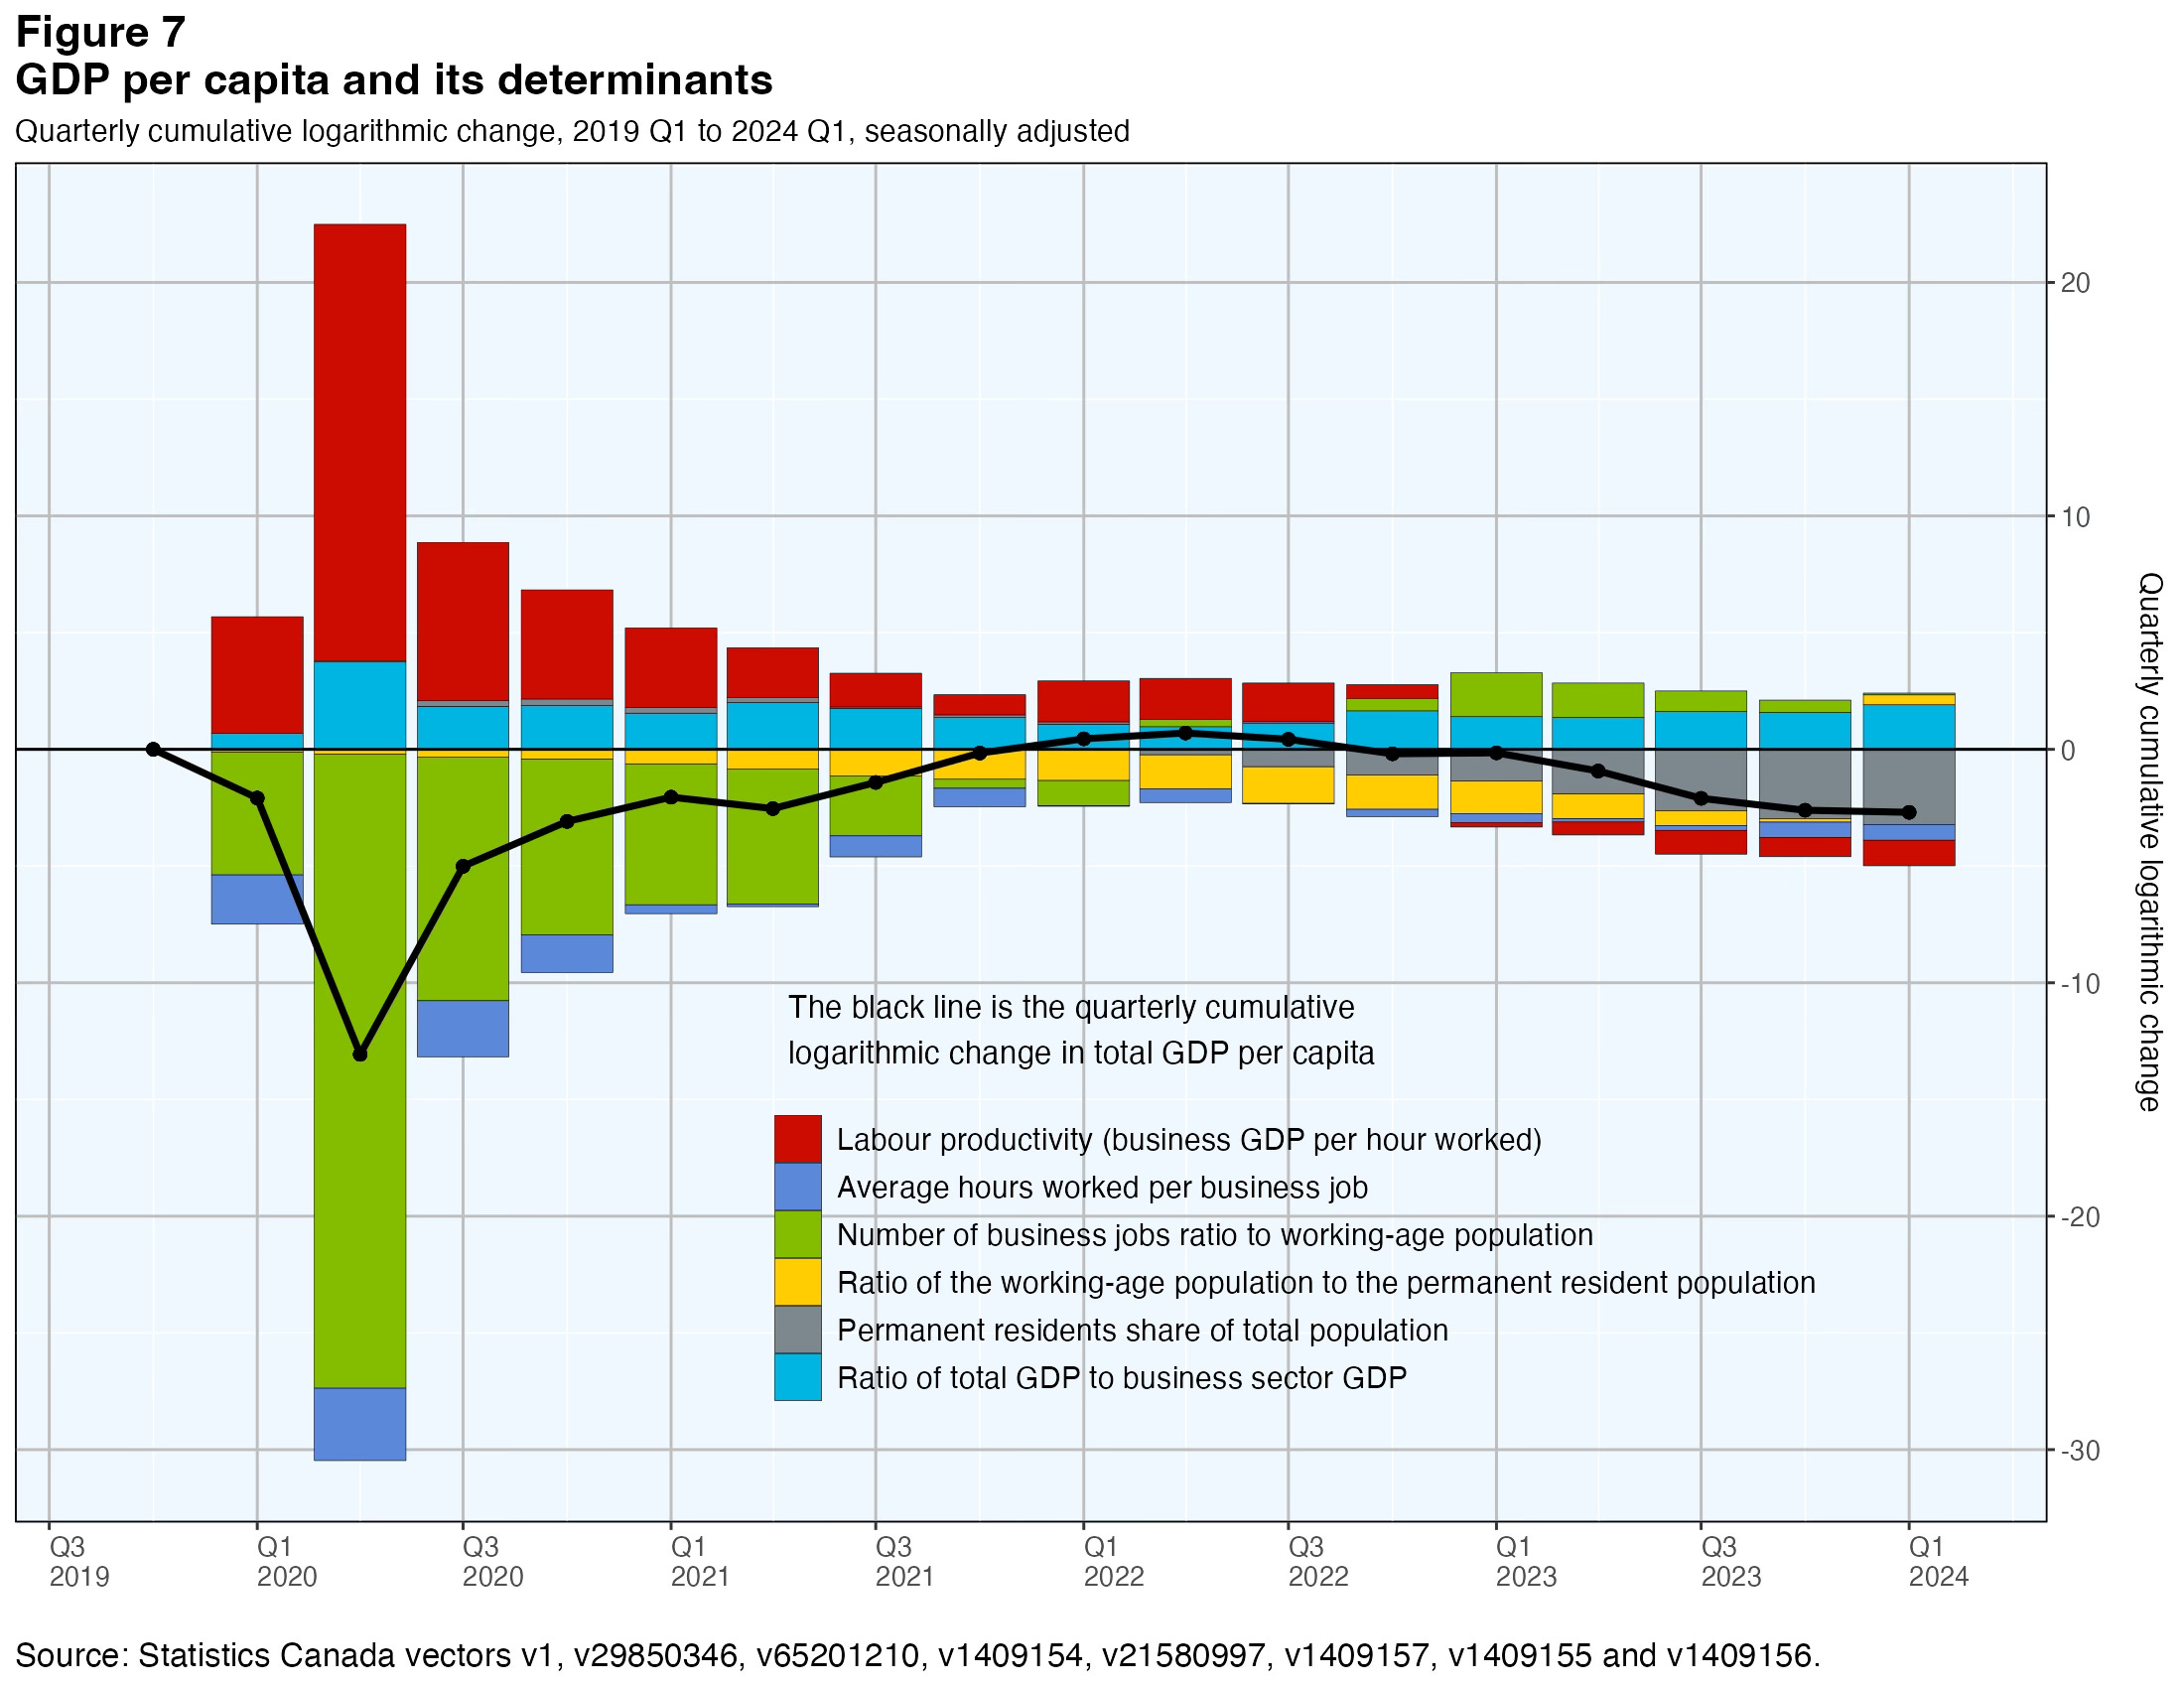
GDP per capita (the black line) plummeted in the first half of 2020 when the economy was ‘locked down’ to limit the virus spread. Thereafter it began a gradual rebound as various steps were taken to limit that spread. The early 2020 drop and the next few recovery quarters were almost entirely accounted for by changes in the employment rate (the green bars - the number of business jobs ratio to working-age population) and average hours worked per business job (dark blue). Labour productivity (red) jumped initially and this change was almost all due to temporary compositional changes rather than innovations in the production process. Businesses laid off or reduced the working hours of their less-skilled, lower-wage employees while ‘hoarding’ their more highly-qualified and difficult-to-replace staff in anticipation that the pandemic disruption would be temporary. In addition, the pandemic affected disproportionately the public-facing industries such as food services and accommodation where lower-skilled jobs tend to be predominant. Since the denominator of the labour productivity ratio does not distinguish how skilled and experienced the employed people are, on average, measured productivity increases simply by having a lower number of low-skilled workers. In effect, the productivity boost can be attributed to the temporary rise in average labour quality. In the subsequent quarters the cumulative change in labour productivity fell back down as economic activity recovered and businesses re-employed lower-skilled employees. During these pandemic quarters the ratio of total to business-sector GDP increased and the remaining identified drivers had little impact.
By mid-2022 the economy was booming and GDP per capita had risen slightly above its pre-pandemic level. The main reasons were that by this time, the cumulative change in the employment rate had turned positive and that of labour productivity remained positive. However, by then the baby-boomer retirement phase-in was well under way,13 serving to reduce the working-age share of the PR workforce (yellow bars) and offsetting some of the impact of the higher employment rate and productivity improvement (Statistics Canada, 2022).
The most recent few quarters, however, reveal the current weaker picture. The pandemic is largely in the past, but the cumulative change in GDP per capita has been moving down, slowly at first and then more rapidly, although the path levelled out in the most recent quarter. The employment rate and the total-to-business GDP ratio are continuing to make positive contributions, but the falling PR share of the population (equivalently the rising share of the NPR population) has become the largest downward driver of GDP per capita. As was discussed earlier in the paper, there are strong reasons to believe the average productivity of NPRs, given the low-wage jobs most are working in, is much lower than that of the PR population. Their productivity contribution is lower and their weight in the overall population has been rising sharply, both factors contributing to declining overall Canadian GDP per capita. Decreasing labour productivity, the falling working-age share of the population and declining average hours worked are additional negative factors.
Summing up: Why GDP per capita is dropping
Canada has recently experienced a number of quarters of shrinking real GDP per capita. If it occurred during a recession, one would attribute the fall to a shrinking economy. But the economy is not in recession. Real GDP growth remains positive and unemployment is still low, although rising. The drop in GDP per capita is, rather, accounted for by:
the diminishing share of the most experienced labour force cohort due to ongoing baby-boomer retirements;
decreasing labour productivity, a complex and high priority longer-term problem with no simple or immediate solution in sight, although in the short term it is related to the next driver; and
a burgeoning NPR population, a factor for which relatively quick fixes are fortunately available, but which require difficult political decisions and imply a short-term dampening effect on GDP growth.
Conclusion
Canada’s real GDP per capita is on a downward track and this should be a matter of concern for all Canadians. GDP continues to grow at well below its long-term potential rate because productivity is flagging. Canada’s population is rising too rapidly, beyond the economy’s annual adsorptive capacity, and its PR-NPR mix is greatly distorted. The problem is compounded by the fact that Canada’s most experienced workers, its seniors, are retiring at a more rapid rate.
The immediate cause of this situation is the stunning increase in NPRs that came in 2022 and 2023. It was quite unexpected and has upset the forecasts and planning of policymakers at many levels. Although the spurt of NPRs did provide a kind of demand stimulus to GDP that helped avoid even weaker growth in 2023, the stimulus was small because the productivity and associated incomes of the jobs NPRs are filling are quite low. A big part of the problem is that the filling of these jobs by additional NPRs has disincentivized business investment and thereby reduced Canada’s overall labour productivity. The large influx of temporary foreign workers to fill low-wage jobs also served to limit Canada’s unskilled PRs from realizing the opportunities and income benefits that would normally have come during the strong economic conditions of 2022, additional income that would have helped sustain consumer spending in 2023.
The government should set annual population growth targets, explain why those specific targets were chosen and use the various tools at its disposal to hit the targets. Recent statements by federal ministers indicate significant movement in this direction. Explicit landed immigration targets have been announced and largely implemented in this way for many years. Now an explicit three-year target for NPRs has also been set for the first time. This practice should continue at least until the acknowledged excessive proportion of NPRs in the population has been reduced below the announced five percent target. Further, the ways in which these targets are achieved also matters. Most importantly, an accompanying goal should be to upgrade the average knowledge, skills and experience of Canada’s labour force as these targets are pursued. This implies minimal transitions of low-skilled NPRs to PR status and greater inflows of highly-skilled immigrants. This is a key part of the solution to Canada’s chronic productivity challenge.
While the government’s NPR reduction plan will have a short-term dampening effect on GDP growth and will cause financial problems for schools and businesses that had quickly become accustomed to the benefits accruing to them from the NPR surge, the policy changes that made this sudden bonanza possible were ill-advised, if well-intentioned, and must be reversed.
Annex
Statistics corresponding to Figure 7
References
Canada Broadcasting Corporation. January 2024. “Federal government announces 2-year cap on student permits.”
Canada Broadcasting Corporation. March 2024. “Federal government aiming to shrink temporary residents’ share of population by 2027.”
Employment and Social Development Canada. 2021. “Evaluation of the Temporary Foreign Worker Program.” Cat. No. SP-1245-09-21E.
Employment and Social Development Canada. April 2022. “Backgrounder: Temporary Foreign Worker Program Workforce Solutions Road Map.”
Employment and Social Development Canada. October 2023. “Government of Canada extends Workforce Solutions Road Map and introduces new wage requirements under the Temporary Foreign Worker Program.”
Immigration, Refugees and Citizenship Canada. April 2022. “New measures to address Canada’s labour shortage.”
Immigration, Refugees and Citizenship Canada. August 2022. “International students to help address Canada’s labour shortage.”
Immigration, Refugees and Citizenship Canada. October 2022. “New measures for foreign nationals with expired or expiring post-graduation work permits and applicants to the temporary resident to permanent resident pathways.”
Immigration, Refugees and Citizenship Canada. October 2023. “Changes to International Student Program aim to protect students.”
Immigration, Refugees and Citizenship Canada. January 2024. “Making Canada’s International Student Program sustainable.”
Immigration, Refugees and Citizenship Canada. March 2024. “Speaking notes for the Honourable Marc Miller, Minister of Immigration, Refugees and Citizenship: Announcement related to Temporary Residents.”
Statistics Canada. April 2022. “In the midst of high job vacancies and historically low unemployment, Canada faces record retirements from an aging labour force: number of seniors aged 65 and older grows six times faster than children 0-14.”
Tuey, Catherine and Bastien, Nicolas. June 2023. "Non-permanent residents in Canada: Portrait of a growing population from the 2021 Census," Insights on Canadian Society, Statistics Canada.
Young, Rebekah and Lalonde, René. March 2024. “Raising the Bar, Not Just Lowering the Number.” Scotiabank Global Economics Insights and Views.
GDP is not the whole story, of course. Well-being is also affected by other factors, notably externalities such as pollution, the availability of leisure time, income distribution, life expectancy and the degree of social harmony. But these additional factors are not the subject addressed here.
In this paper the word ‘immigration’ refers to people applying for and being granted permanent resident status in Canada. People coming to Canada with student visas, or with temporary foreign worker permits, or having applied for but not yet being granted asylum are not considered to be immigrants. Rather, they are non-permanent residents. Be aware that some people broaden the term ‘immigrants’ to include non-permanent residents.
A useful though inexact comparison is that Canada’s overall participation rate was 65.6 percent and its employment rate was 61.8 percent in the fourth quarter of 2023.
The government relaxed some of these limits in 2022 because of perceived labour shortages. That decision largely explains the surge in NPRs seen in 2022 and 2023.
The minimum hourly wage in Canada varies by province and territory and the population-weighted average is $15.88. However the considerable majority of NPRs appear to work in Ontario and British Columbia where the minimum wages are $16.55 and $16.75 respectively. In addition, some NPRs might receive more than the minimum wage. Assuming NPRs earn $17 an hour on average, work 32.5 hours a week (30 percent of permit-holders have study permits only and work part-time) and are employed for 50 weeks in the year would imply earnings of $27,625. However, many NPRs are unlikely to work 50 weeks in the year and indeed some remain in Canada less than a year, so this crude estimate was reduced to $25,000. In contrast, Statistics Canada’s survey of employment, payrolls and hours indicated that average earnings of all employees were $63,013 in December 2023. The crude estimate of $25,000 a year for NPRs may well be too low, but the point is simply that NPRs, on average, must surely have earned much less than PRs.
Lest there be any confusion, there is no hypothesis testing here. The six factors in the GDP per capita decomposition are chosen simply because they are believed to be important influencers. The decomposition reveals their relative importance over time.
Statistics Canada, in its labour productivity statistics tables 36-10-0206 and 36-10-0207, works with the concept of jobs rather than employees and that is also the approach adopted here. One employee can of course have more than one job.
It could be argued that a better formulation would be the number of business jobs expressed as a ratio to the total population, since some of those over 65 year of age are also employed. However relatively few seniors are employed — just 5.2 percent in March 2024, only a small increase from 4.8 percent five years previously — and of those who are employed, 43 percent worked in part-time jobs in March 2024. Identifying the impact of increasing retirements of baby-boomers, which has the effect of reducing the working-age population (15-64 years of age as conventionally defined) is an important objective here so this alternative approach is not taken.
A full general equilibrium analysis would be very useful here, with a well-specified model, estimated parameters and a good statistical portrait of the types of work done by NPRs and their remuneration. This is however beyond the scope of this paper and in any case would probably not be feasible given the limited available data.
Imputed rents on owner-occupied dwellings are included in the GDP concept, by all countries, mainly so there will not be swings in GDP due simply to shifts in household preference with regard to housing ownership/rental. If I rent my house to you while you rent yours to me there will be no change in GDP compared to the case where we just live in our own houses.
When this paper was written, statistics were available for all the required variables up to and including the first quarter of 2024, but with two exceptions. The exceptions are connected to the fact that for purposes of this paper population is measured at the end of the quarter. Statistics Canada’s most recent estimate of Canada’s population at time of writing was for the end of the fourth quarter of 2023. Accordingly an assumption was made about the first quarter population: that it was 41,000,000. This implies the same 0.6% quarterly increase during the first quarter as in the previous quarter. For similar reasons, it was assumed that the net inflow of NPRs during the first quarter was 108,400 which is about the same as in the first quarter of 2023 (since NPR net inflows are seasonal). By making these assumptions we extend the entire analysis into the first quarter of 2024, but the reader should keep in mind that the results for the last quarter depend on these assumptions.
In Figure 7, starting from the 4th quarter of 2019, some of the following quarters show increases and others decreases. This chart does not show those increases and decreases directly (although it could be drawn that way as an alternative). Rather, for each quarter the chart shows the cumulative sum of all the changes, positive and negative, up to that particular quarter. It shows, for example, that in 2021 Q4 GDP per capita was finally back to the point where it was in 2019 Q4, and it shows this was due to the fact that increases in labour productivity and the ratio of total GDP to business GDP (relative to 2019 Q4) fully offset the continued cumulative decline in the other four components (again, relative to 2019 Q4).
The postwar baby boom peaked in the mid 1950s after which birth rates began a gradual decline. Babies born in the late 1940s and 1950s, now adults, have been retiring since around 2010 and the numbers that are doing so have been increasing.
I found your analysis very interesting. Your choice of focusing after mid-2022 is understandable.
However, I wonder if a longer term analysis of the effect of %NPR on productivity wouldn't be interesting. From looking at the graphs, the first major leg down from the US was in the late 80's when there was a coincident rise in NPR as a percentage. Understanding this could help longer term policy prescriptions.